Price action patterns are a popular and effective tool for trading to analyze price movement over time.
And the Good Part: there are over 20+ patterns available, each with its unique characteristics and signals.
While not all traders use all patterns, understanding a variety of patterns can provide valuable insights into market trends and inform trading decisions.
In this guide, we will explore some of the most popular price action patterns that traders can apply in real-time market situations to make money.
So whether you’re a beginner or an experienced trader, this carefully written guide provides some unique insights that can help you take more informed trades in today’s dynamic financial markets.
Key Takeaways
- Price action patterns are valuable tools for analyzing market trends and making trading decisions.
- Understanding different patterns can provide insights into market behavior and help traders improve performance.
- Patterns include reversal patterns like head and shoulders and double tops/bottoms, as well as continuation patterns like flags and triangles.
- Consolidation patterns indicate market stability and can present opportunities for future trades.
Price Action Patterns
Price action is a term that has been around for years, but its importance in the world of trading has only become more apparent recently.
Price action refers to the fluctuation in the price of a security over time.
It can be used to recognize and identify trends, support and resistance levels, and other patterns that can be used to make informed trading decisions.
There are various types of price action that traders use when analyzing the markets, including swing highs and lows, breakouts, and trendlines.
So, what are price action patterns?
Many traders think they’ve got a sharp eye on the market.
Little do they know that they haven’t known much about it yet until they come across this article on chart patterns.
Price action patterns are the key to successful trading! These patterns let you know where prices may be headed and help you spot profitable opportunities in the markets.
Say goodbye to guesswork and hello to precision trading!
Let’s get right into the different kinds and how to use them without wasting much time.
Types Of Price Action Patterns
Price action patterns can be broadly divided into two types.
These are:
- Reversal patterns
- Continuation patterns
Some may say that there is another pattern known as the consolidation chart pattern.
Well, we’ll get to that soon.
For now, let’s talk about Reversal Patterns
Price Action #1: Reversal Pattern
For instance, if you have been traveling in a particular direction for a long time, you would get to a point where a change in direction would be needed, right? Yes.
The same applies to trading.
When the price has been in one type of trending phase for a while, the price will most likely need to change its direction.
But as for price, it leaves footprints, hints, and suggestions that it wants to change its direction beforehand, if only you know these hints.
This is why I will be sharing with you guys the top 2 reversal patterns that can help you spot a change in a trend as quickly as possible.
Head and Shoulders Patterns:
This price pattern is formed when the price makes a high followed by a higher high, then a lower high.
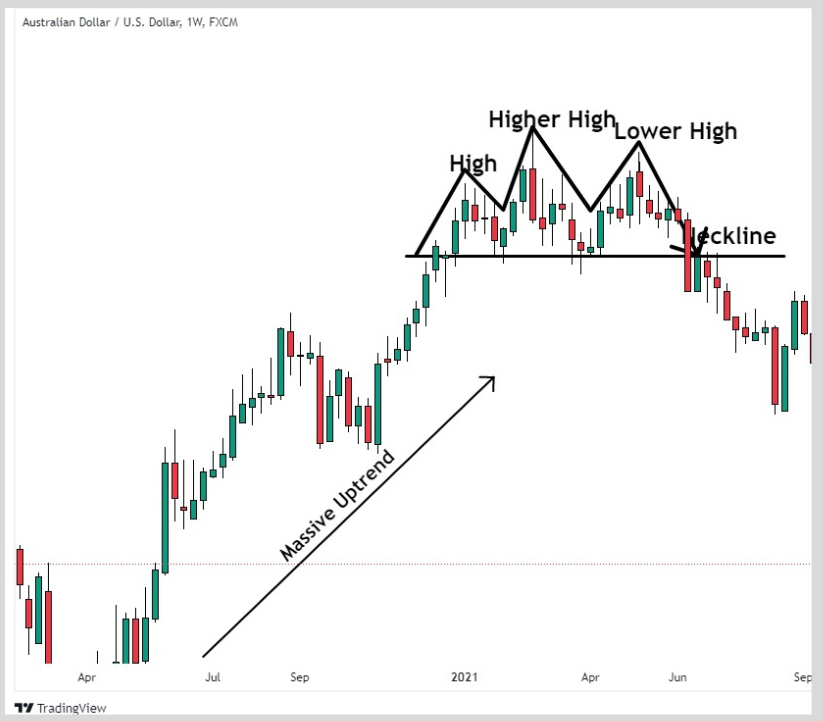
The price pattern always tends to cause trend reversal.
Let’s look at the aftermath of the formation of this pattern.
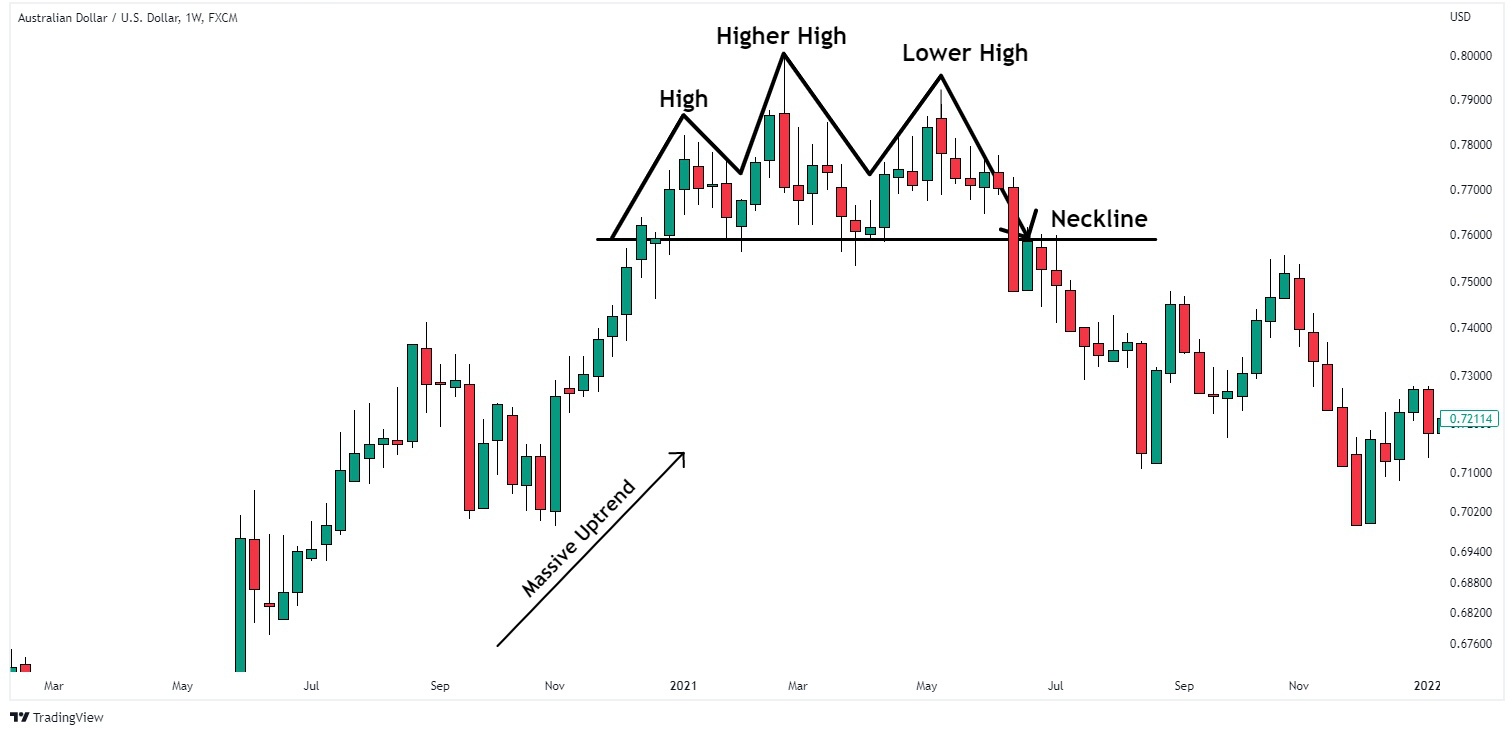
And…there you go, the price changed its direction completely
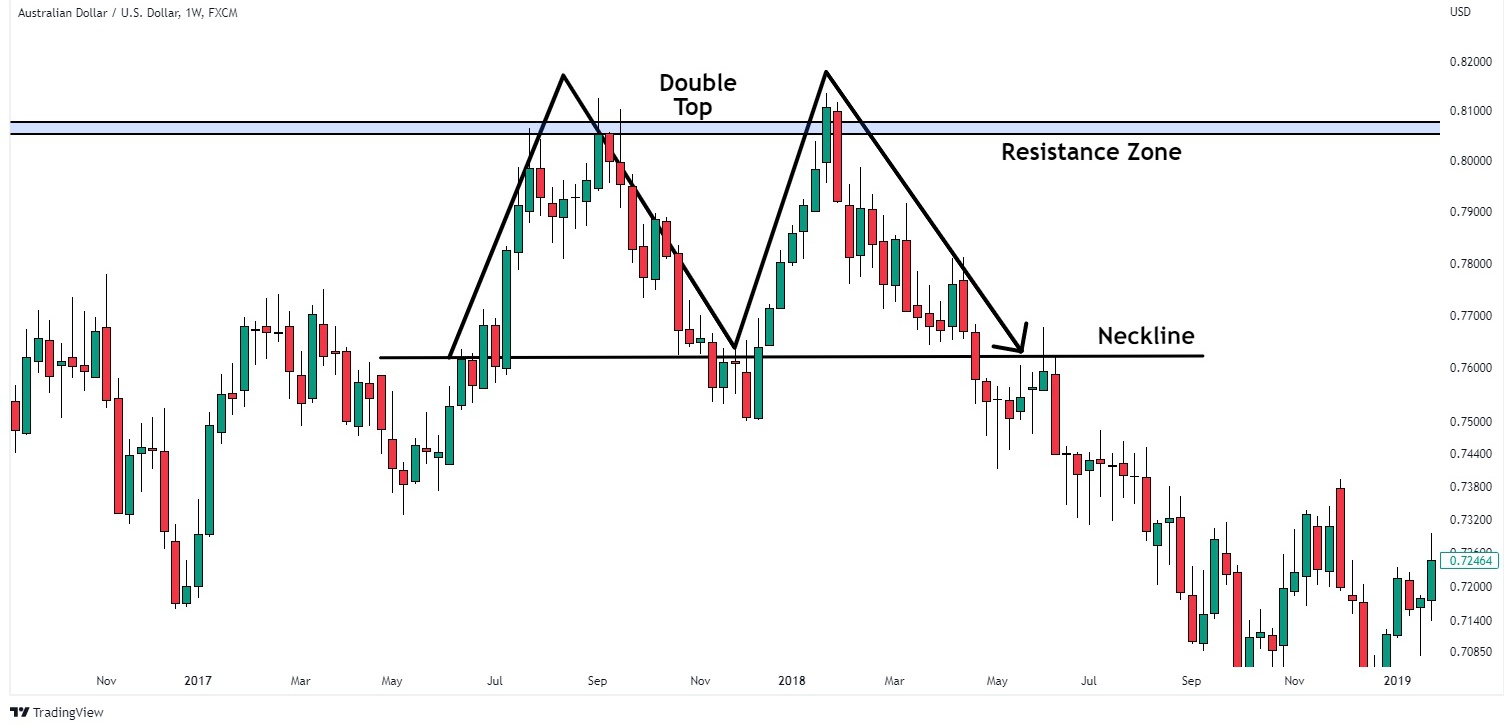
Double Tops and Double Bottoms Patterns:
Double Top Patterns are one of the most popular patterns in technical analysis.
They are formed when security reaches a very high point twice and then starts to decline.
This pattern is used by traders to identify potential reversal points in the market structure, which can be used to make profitable trades.
Here is an example
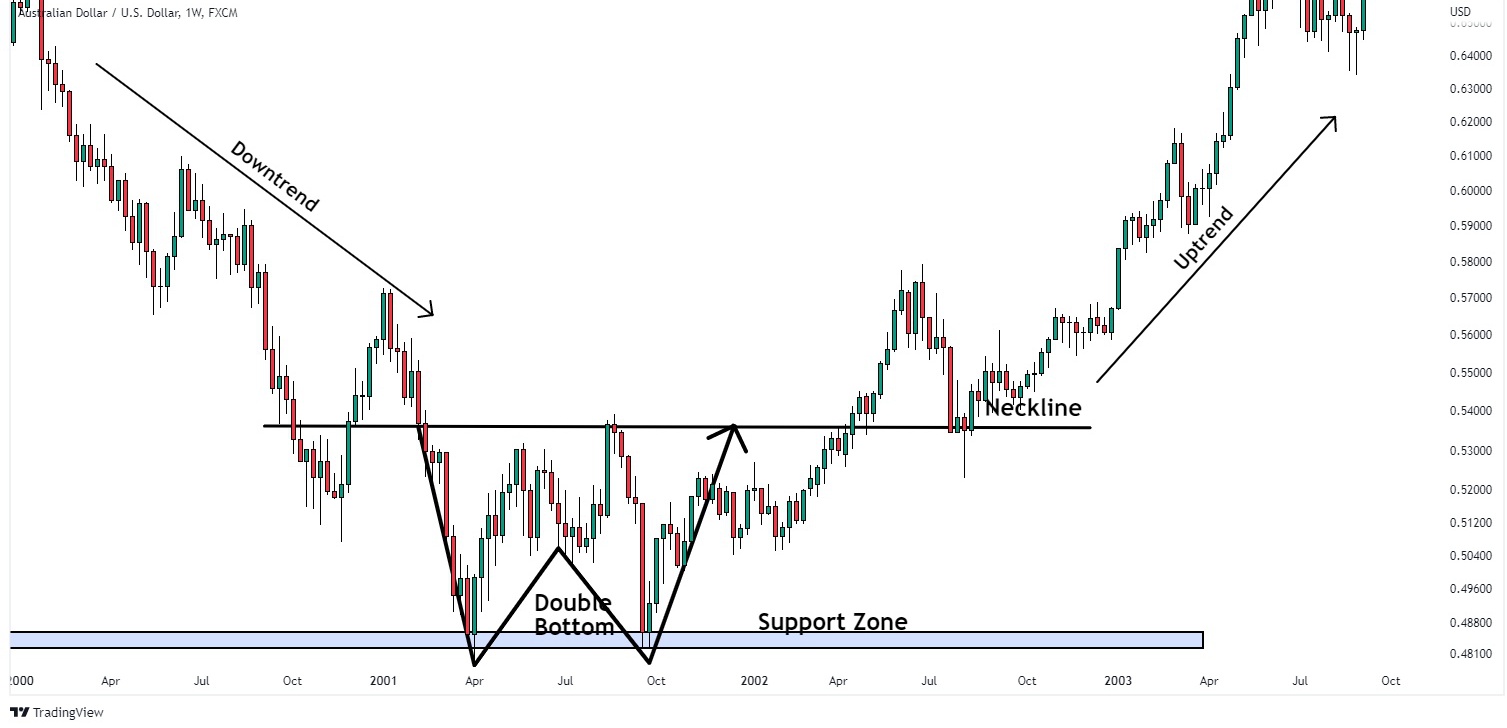
Double bottom patterns are very juicy patterns formed in the financial market – they can signal a potential reversal of a downtrend and provide investors and traders with an opportunity to make profitable trades going up.
Below is a pictorial example of this chart pattern.
Price Action 2: Continuation Chart Patterns
Still using the example of you traveling, sometimes you make a brief pause during the journey if it is too long, either to get something, sleep, weather conditions, or any other reason, before you continue the journey, right?
Yes, I believe so, but guess what?
The same thing applies to trading.
When the market is in a very strong trend, it could be bullish or bearish; the price would need to catch its breath after an impulsive move.
After this, the price can seek to continue its move again.
Now, for more clarity, Continuation patterns are an important tool for every trader.
These patterns help traders spot possible breakouts and signals that a trend will continue.
By knowing how to spot these patterns, traders can make smart choices about their trades and get the most money out of them.
Let’s have a look at the different kinds of continuation patterns.
Flags and Pennant:
Flag and Pennant patterns are types of chart patterns that traders look for to find out if a trend is likely to continue.
They happen when the price of an asset stays in a narrow range for a while and then breaks out in one direction or the other.
Now, we have two types of flags.
- Bullish flag and the
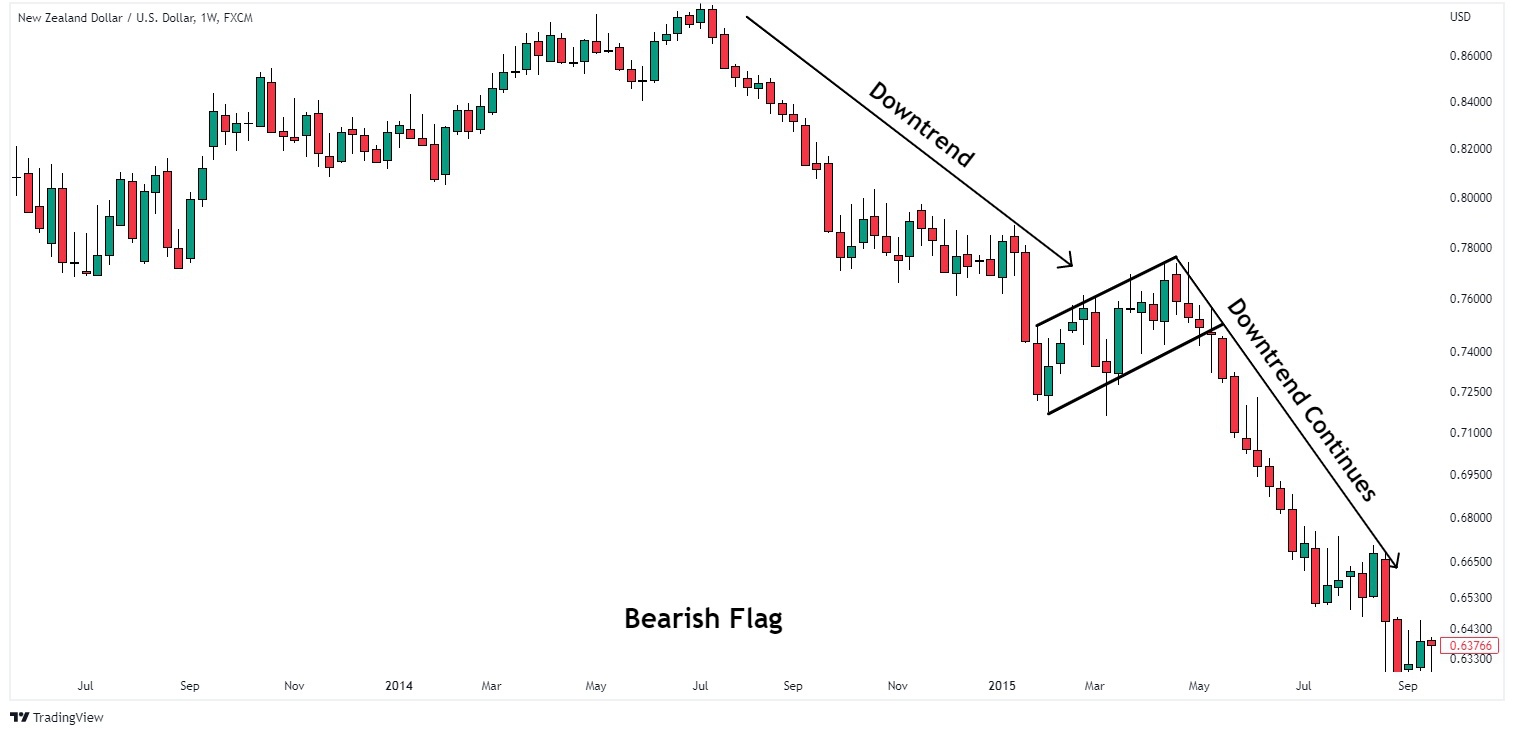
- Bearish flag.
The bullish flag, just as its name implies, signals a continuation to the upside.
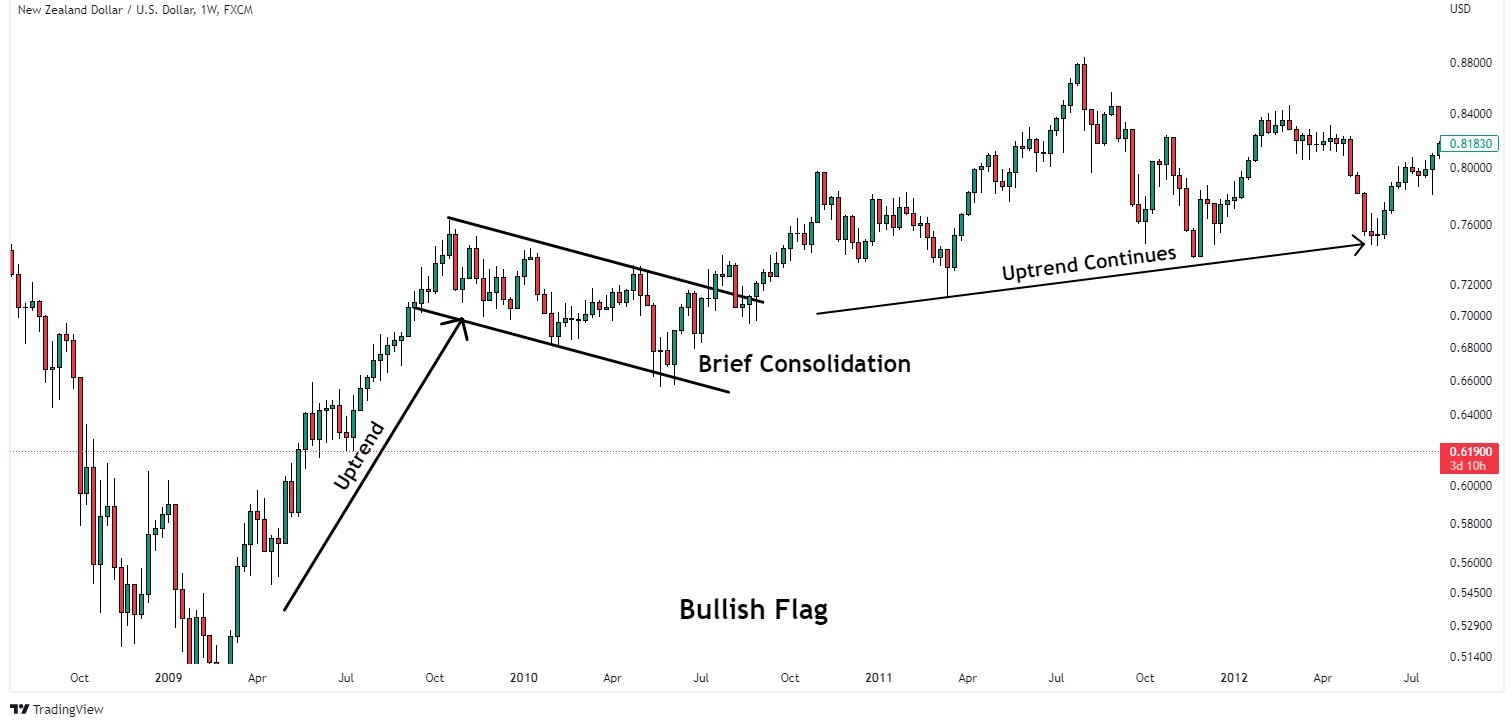
While a bearish flag signals a continuation to the downside.
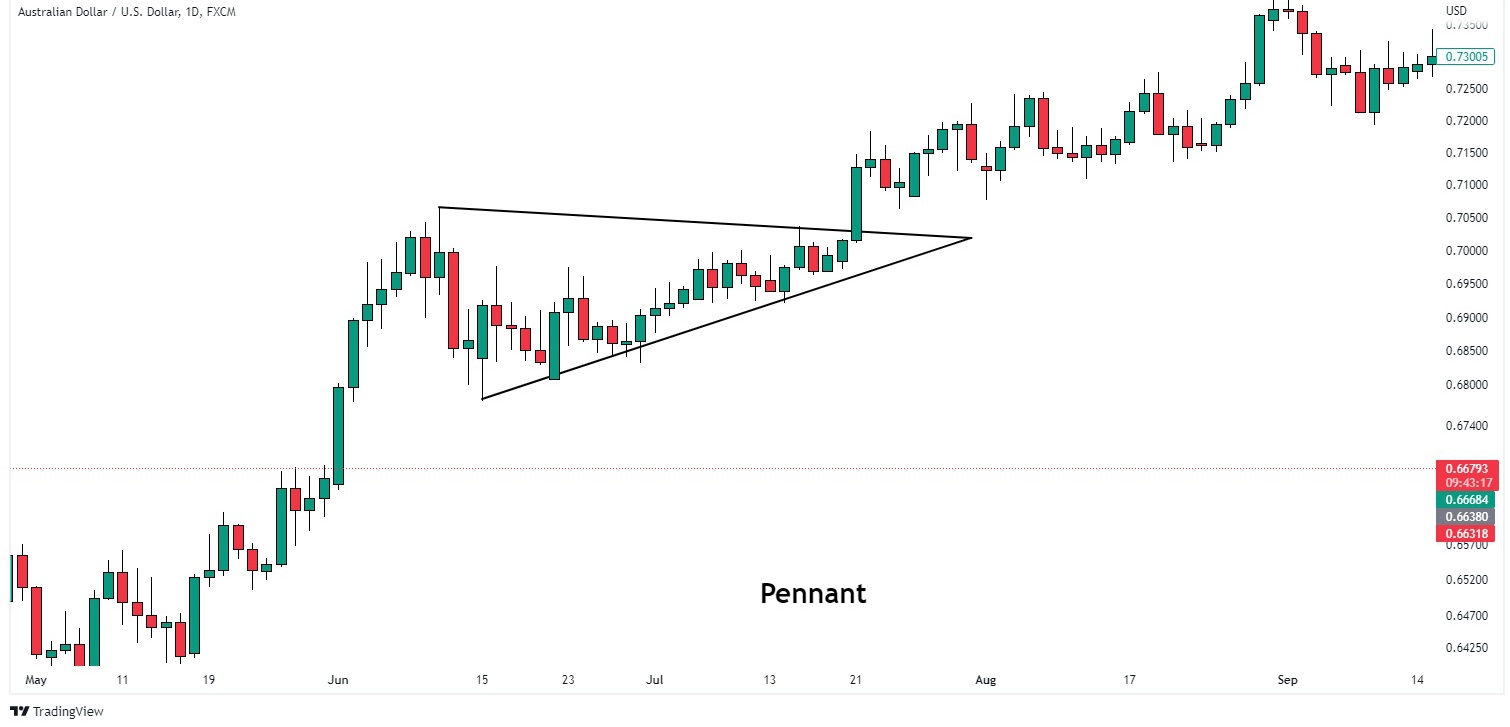
Pennant.
Price Action 3: Triangle Patterns
These triangle patterns can broadly be divided into two.
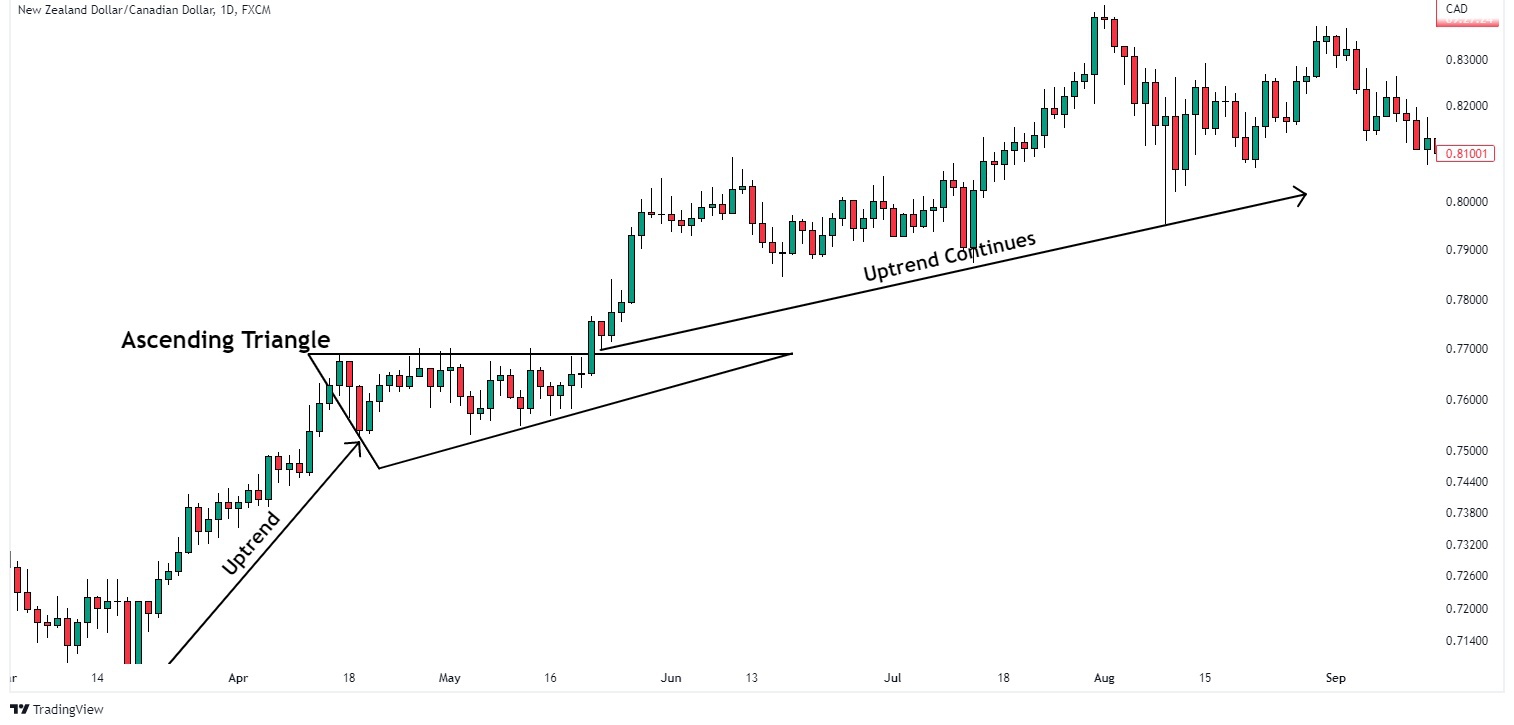
The first one is the ascending chart pattern.
An “ascending triangle” is a bullish chart pattern that can be used to describe an ascending pattern.
When the price of a currency pair keeps making higher lows, and the resistance level stays mostly flat, this pattern is formed.
Drawing a horizontal line at the level of resistance and a diagonal line between the highs and lows makes the pattern.
Traders usually look for this pattern to find a possible continuation of a bullish trend, since the price is likely to break through the resistance level and keep going up.
When the price breaks through the resistance level, traders can open a long position with a stop loss below the breakout point.
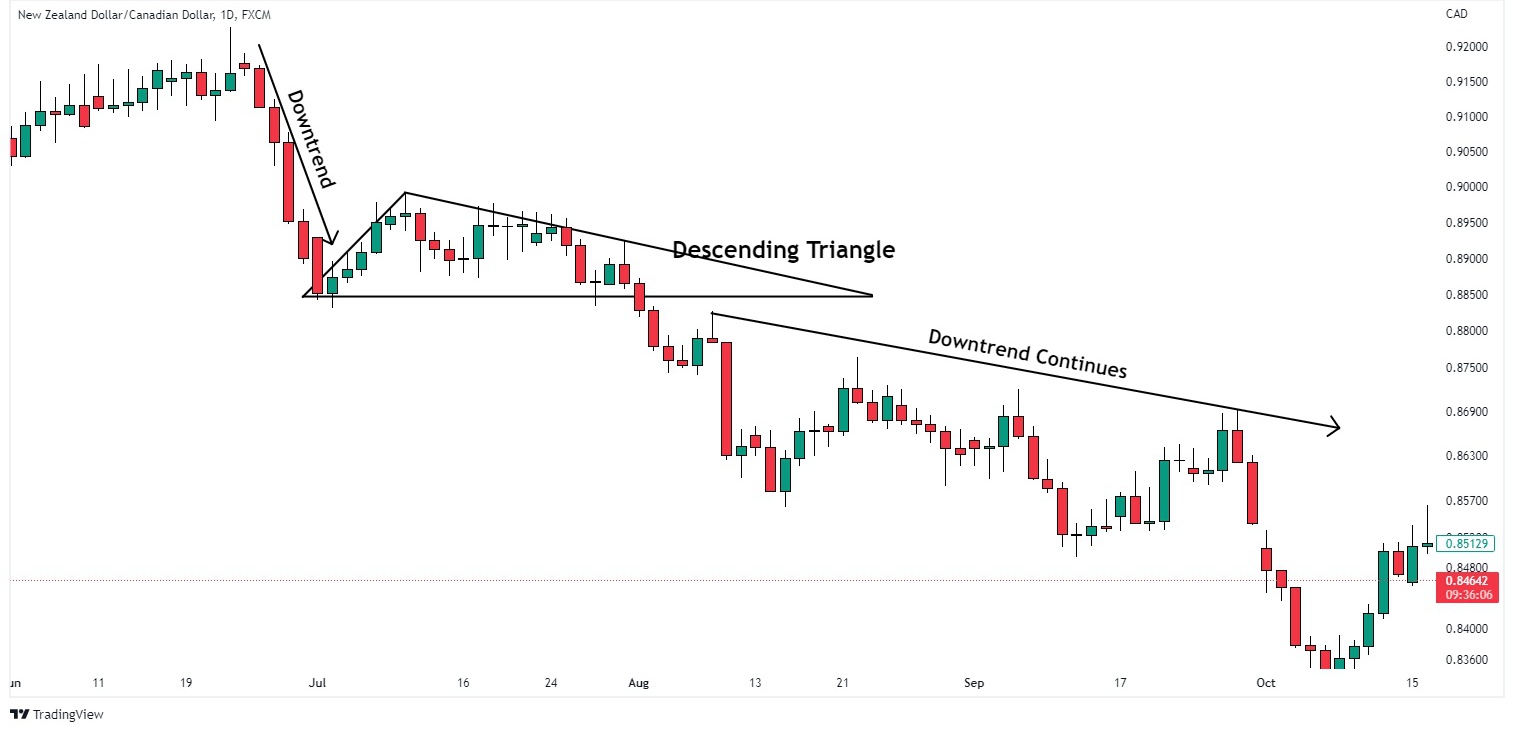
The second one is the descending chart pattern.
When the price of a currency pair makes a series of lower highs while the support level stays mostly flat, the Descending Chart pattern is made.
Drawing a horizontal line at the level of the support and a diagonal line between the lower highs makes the pattern.
Traders usually look for this pattern to find a possible continuation of a bearish trend, since the price is likely to break through the support level and keep going down.
When the price breaks through the support level, traders can go short with a stop loss above the breakout point.
It is as simple as you have seen.
As I promised you guys earlier, I will be talking about the consolidation pattern.
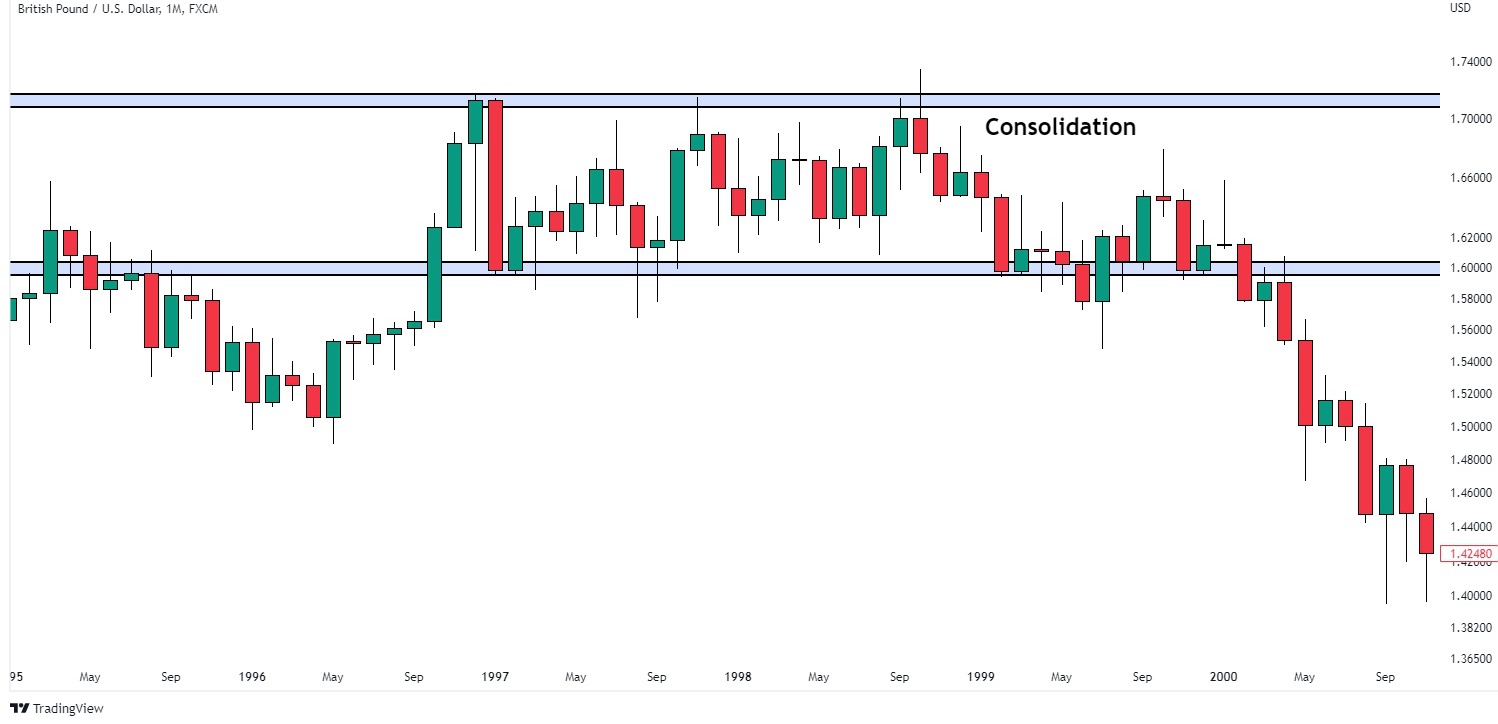
Price Action 4: Consolidation pattern
Consolidation can be seen as a sign that the forex market is stable.
It’s a time when the market stops following its usual patterns, and prices move around in a way that’s hard to predict within a range.
It’s important to remember that consolidation can be frustrating for some traders because the prices don’t move much, which can lead to smaller gains or losses.
This is the period when most traders blow their accounts.
They get smoked by the market.
But it can also be a good chance to plan and get ready for possible trades in the future.
Overall, consolidation is an important part of forex trading that traders need to be aware of and ready for.
Do you now get it?
Consolidation by itself does not give a specific direction for the market.
It can either be to the upside or the downside.
You can prepare for breakouts during periods like this.
Summary
In this article, you have learned the different types of price action chart patterns and how to identify them in your charts.
Here is what you would do for me.
Go on your charts, look for these chart patterns, and see how many times they occur in price action.
Other Resource: Price Action Traders’ Biggest Mistakes and Their Fixes.