This is the ultimate guide to price action trading. You will discover the following.
- How price action works.
- How to use price action to identify the next move in price.
- How to use price action to capture Explosive moves in the market (works in all timeframes)
- And much more…
Key Takeaways
- Price action provides clear trading signals rather than relying on your personal feelings.
- Practical strategies that combine the elements discussed in this article are very effective for making good trading decisions.
So let’s get started.
What Is Price Action In Trading?
Price action trading is a form of technical analysis that uses historical price data to predict future price movements.
It is based on the idea that the past performance of a financial instrument informs future decisions.
Price action traders use chart patterns, support and resistance levels, and other indicators in support of price action that a naked chart provides to make trading decisions.
One of the most distinctive attributes of price action is that it provides you with enough information on what to do and not what you feel you should do at a given time.
For instance, Price action is telling us that USDJPY is in an uptrend direction.
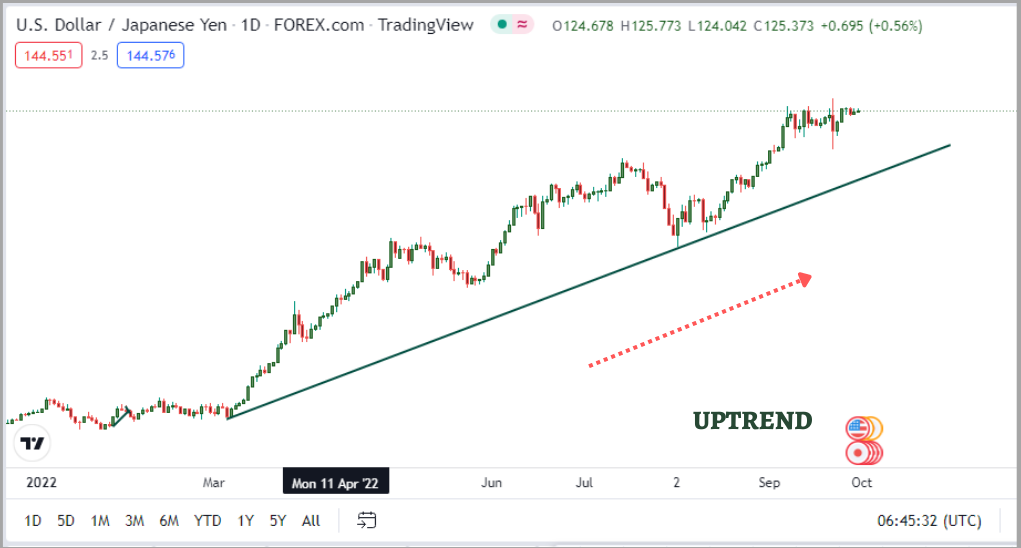
So when we see this, then we know we are to look for potential buying opportunities.
That goes by the saying ” the trend is your friend“; only price action can tell you that.
To have a full grasp of how to apply Price Action to your trading, you have to understand some essential tips that Price Action comprises.
The following are the essential tips:
- Support and Resistance OR Key levels (as I like to call them)
- Swing Highs and Swing Lows
- Phases Of The Markets
- Candlestick Patterns
- Chart Patterns
- Trendline
Let’s look into each of them.
Price Action Support and Resistance
Support: This is simply the level or zone where buyers or the bulls take control to push the price higher.
This can also be said to be the zone at which the selling pressure is least felt or seen in the market.
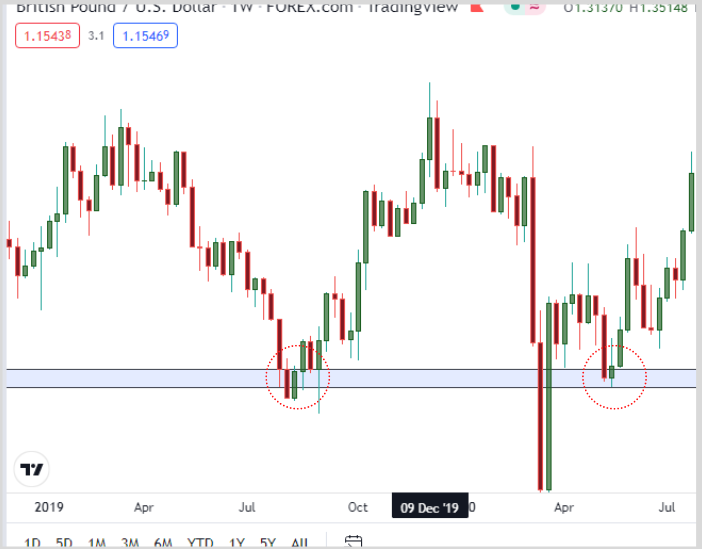
Do you see how the price reacted from the zones you can see above?
Resistance: This is a zone from which the bears or sellers take control to push prices lower.
This is also the zone where the pressure of the buyers is least felt.
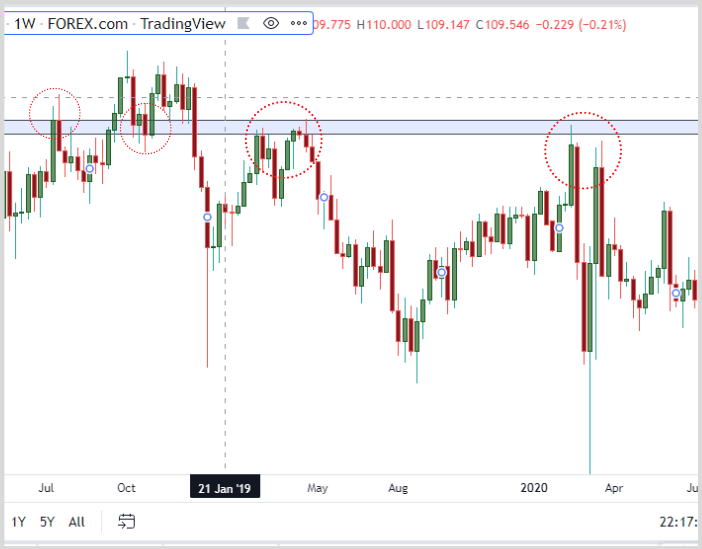
Support and resistance are also called key levels in forex.
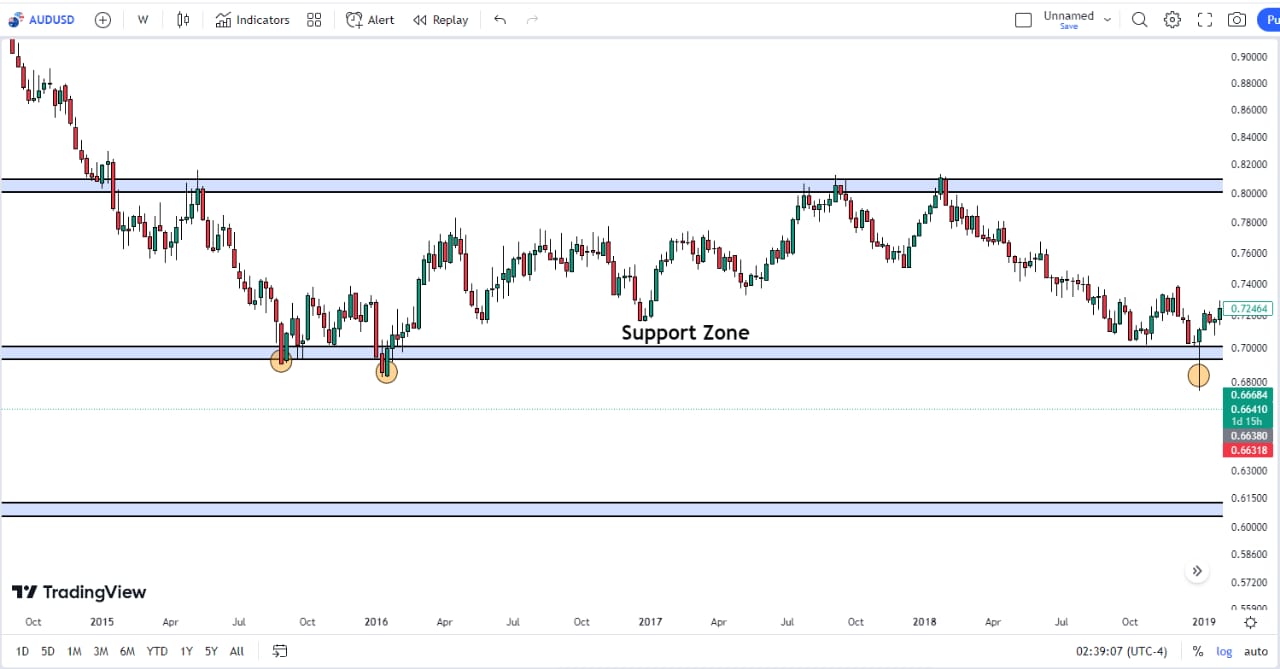
How do you draw your key levels?
Here are simple steps you need to take when drawing those key levels.
- First, zoom out to the highest possible timeframe
- Then, identify areas on the chart that, when the price comes to, it gives a certain reaction.
- Draw your horizontal zone connecting all those areas
There is an interesting caveat to take note of.
A support zone can become a resistance zone, and so also can a resistance zone become a support zone.
I’d explain
When the price breaks a support zone to the downside, and it comes back to try to break through the support zone upwards and fails, then that support zone has already become a resistance zone.
Recall the meaning of support and resistance…
Then we have the opposite is true for a resistance zone down below.
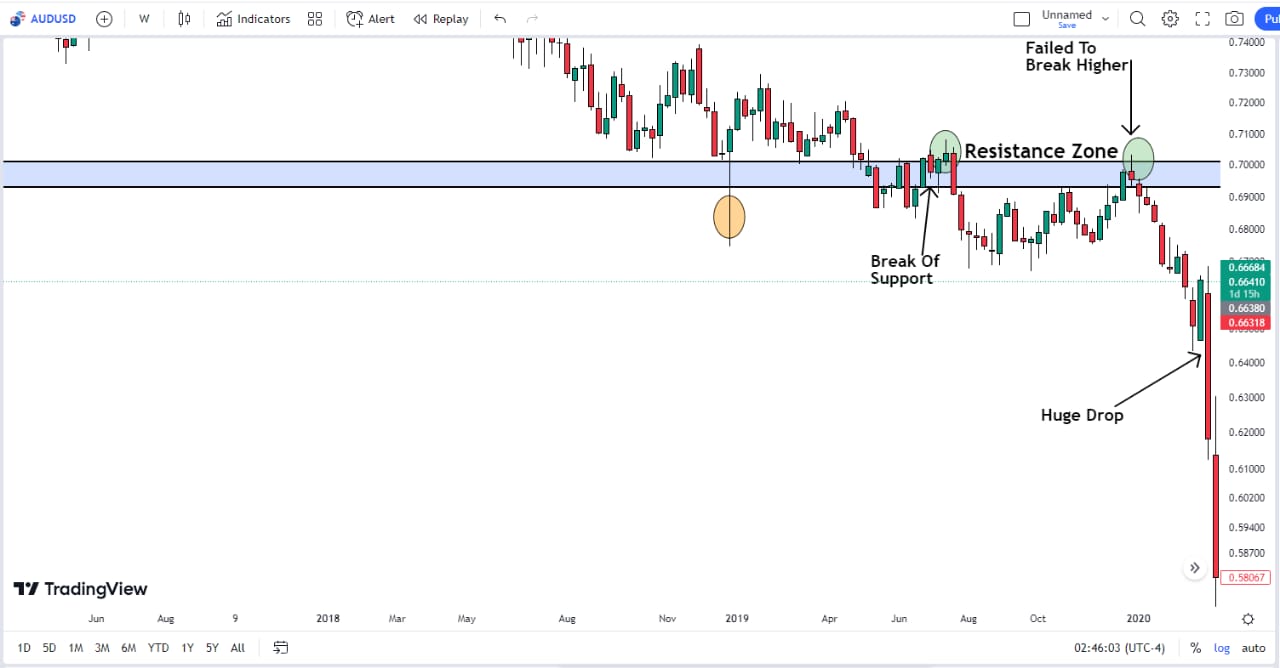
This means when the price breaks a resistance zone to the upside, and it comes back to try to break through downwards and fails, then that zone can be marked as a resistance zone.
Swing Highs and Swing Lows
A swing high is the high created that is higher than any other surrounding highs within a marked period.
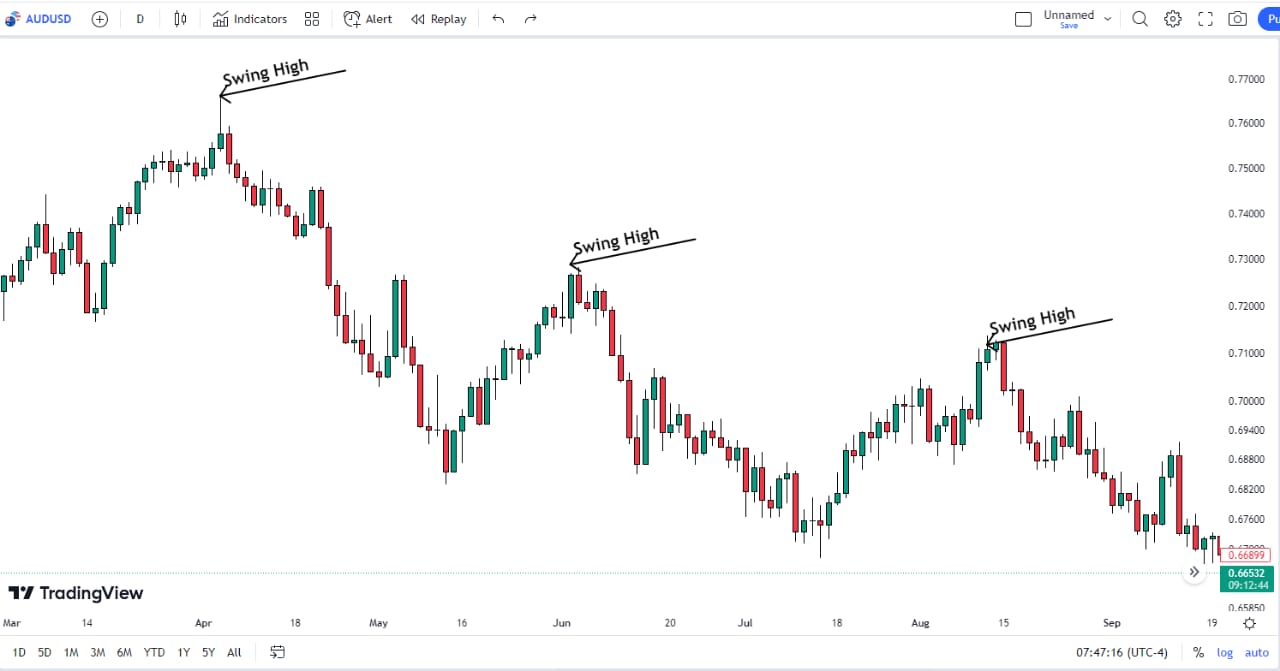
Swing lows are lows created clearly lower than all other lows around it within that specific time.
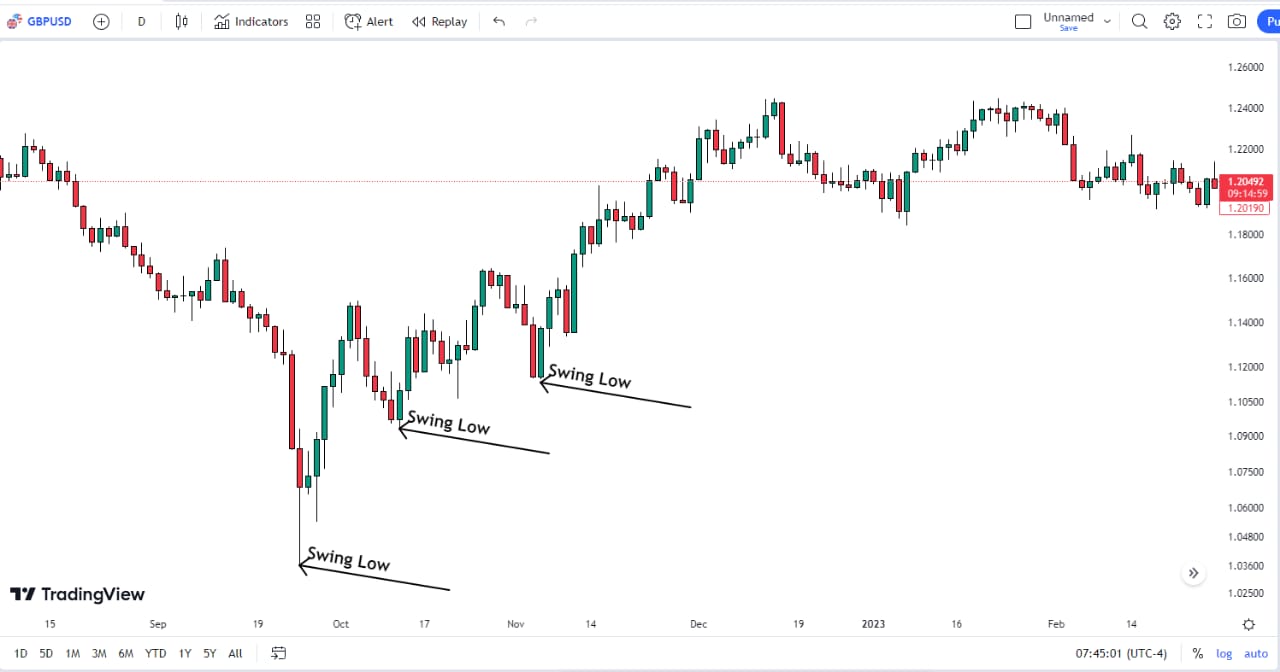
Swing highs and lows are used to create strategies and identify possible turning points in the market structure, and can also be used to identify trends in the market.
Phases of the Market
Price action moves in three phases. These are:
- Accumulative phase
- Distributive phase and
- Trending or advancing phase.
Accumulative Phase:
This is a phase in the market where the price is in its resting stage before it expands higher or lower.
This is also the phase in the market where orders are being collected to prepare for the next trending phase.
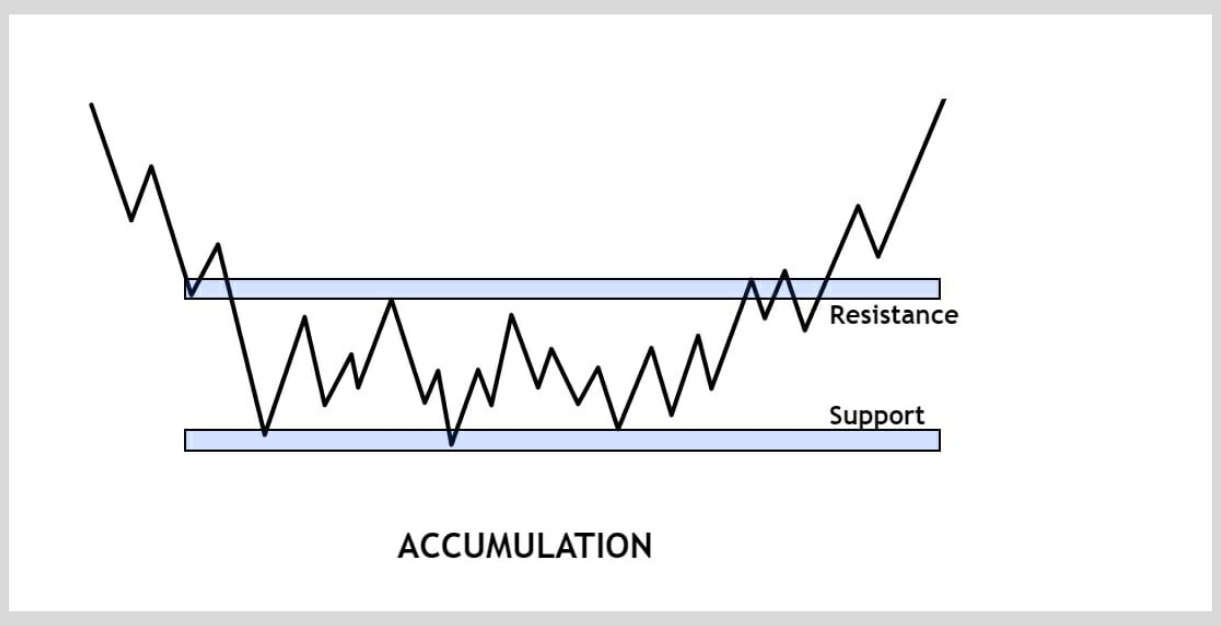
Pro Tip: This phase usually occurs after a great fall. It can also occur after a great ascent in price.
Distributive Phase:
Similar to the accumulative phase, it is also a resting phase of price, but this phase occurs after the price has expanded upwards.
In this phase, prices usually collect orders in preparation to collapse.
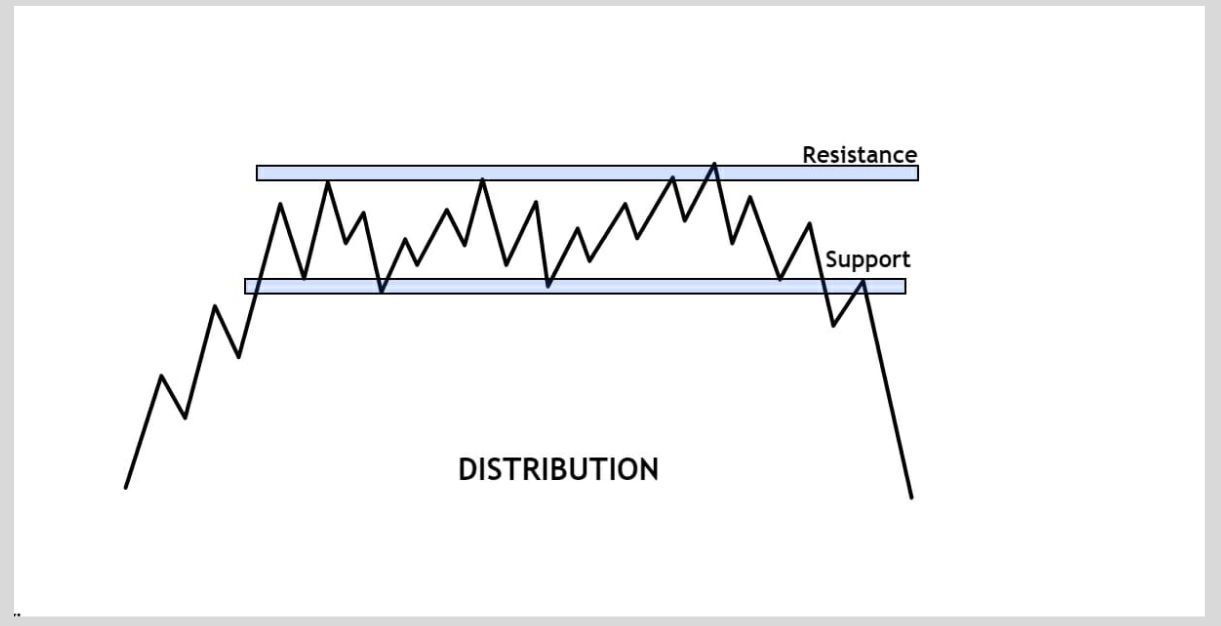
Pro Tip: This phase usually occurs after the price has trended upwards.
It can sometimes indicate that the price would most likely continue its move to the upside.
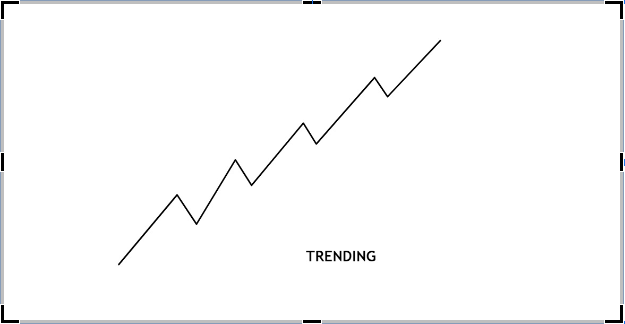
Trending Phase:
Different from the previously discussed phases, this phase is when the price is expanding, which could either be to the upside or downside.
This is the phase of the market in which traders look to buy or sell the market depending on the direction in which the price is moving.
Candlestick patterns
Many different types of candlestick patterns can be used in trading.
But guess what? I would not bore you with the different types of candlestick patterns there are.
But as an experienced trader with more than 11 years of trading, I have been able to test them all and can now bring to you the top three candlestick patterns that have been profitable.
Before we go into my top 3 candlestick patterns, let’s first understand what they mean and, more importantly, how to read them.
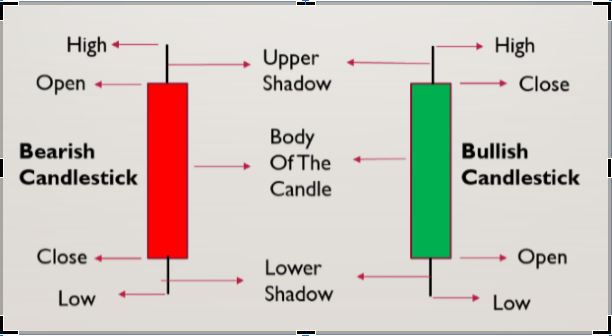
But first, what is a candlestick?
A candlestick is a technical tool that contains lots of information about the past and present condition of the market. They contain information like the open, high, low, and close of the market.
They also show whether we are bullish or bearish by the color they show.
(this could be subjective because some people are color blind while others can identify color which makes them change the color of the printing candles to the one that is most suitable for themselves)
So, how do you read a candlestick?
The most important information you want to get from a candlestick at a glance is:
- Height of the candle
- Low of the candle
- Opening price and
- Closing price.
So let’s see from a pictorial example
Price Action Candlestick Patterns:
The Top 3 Most occurring candlestick patterns you could ever come across when trading.
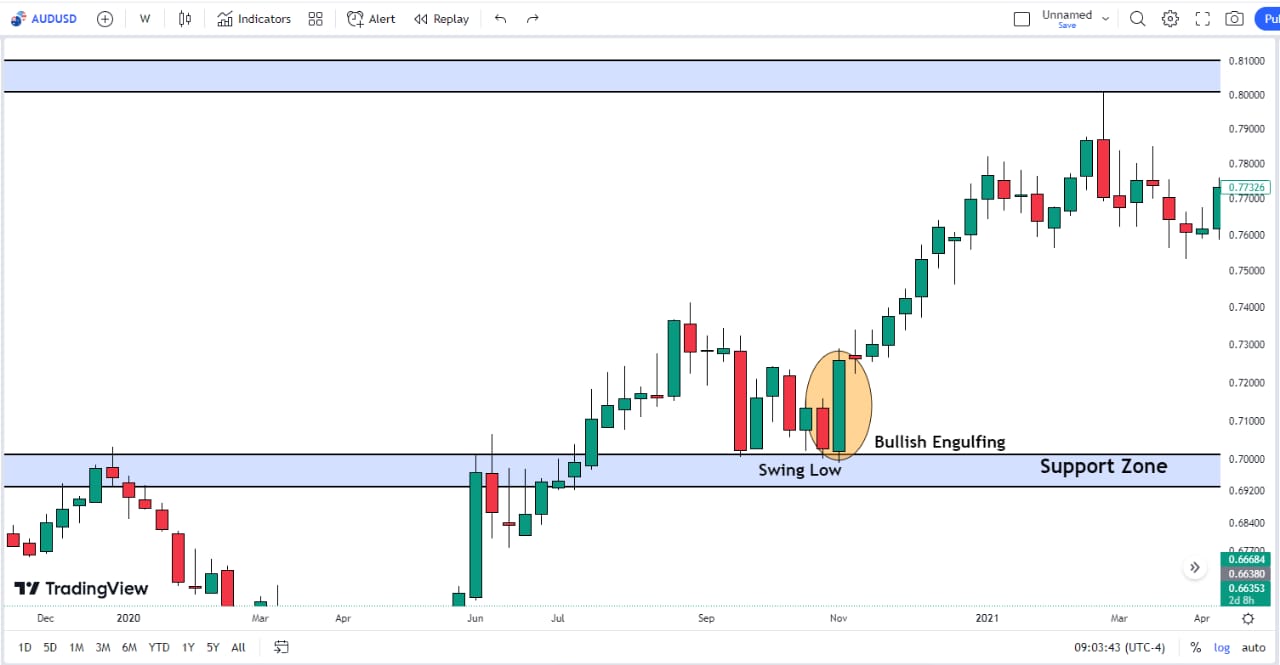
Engulfing Candles:
Engulfing candles involves a candle overshadowing the one that is either before or after it.
That is, one candle engulfs the other.
This candlestick pattern could either be a bullish engulfing candlestick pattern or a bearish engulfing candlestick pattern.
A bullish engulfing candlestick pattern shows that the bullish candle totally engulfs the next candle right before it.
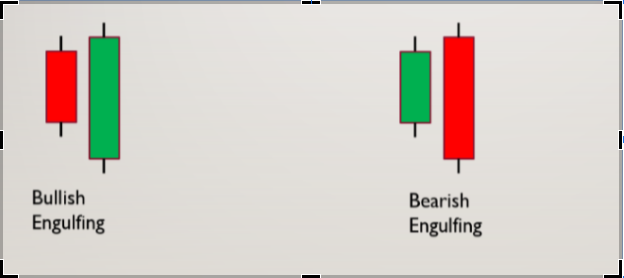
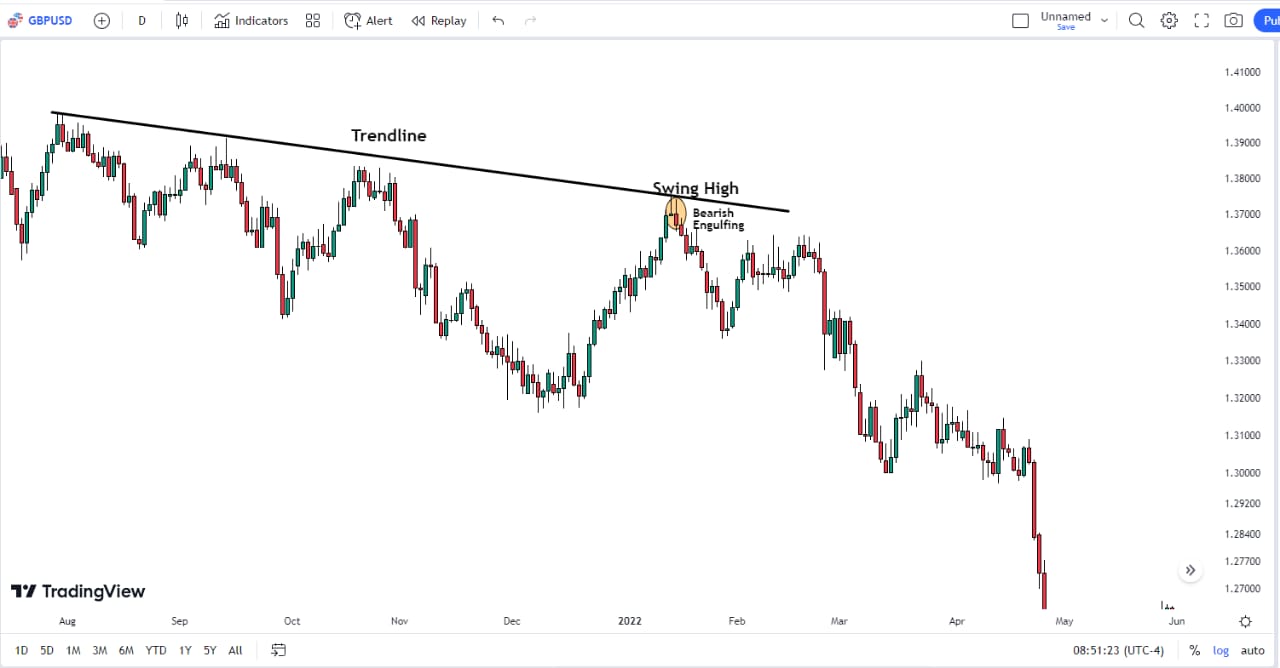
A bearish engulfing candlestick pattern shows that the bearish candle totally engulfed the candle right before it.
As you can see from the above.
Rejection Candles:
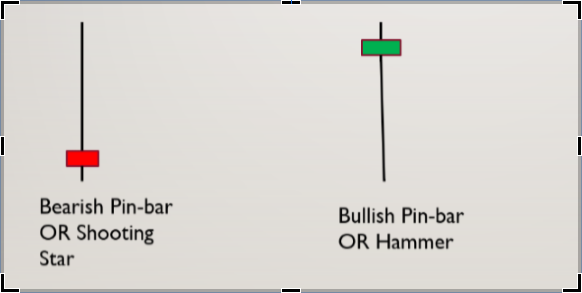
This candlestick pattern occurs singly, but it contains a lot of information.
This candlestick shows that there is a tendency for the price to change its direction completely.
This also occurs in two forms, which are bullish rejection and bearish rejection candlestick patterns.
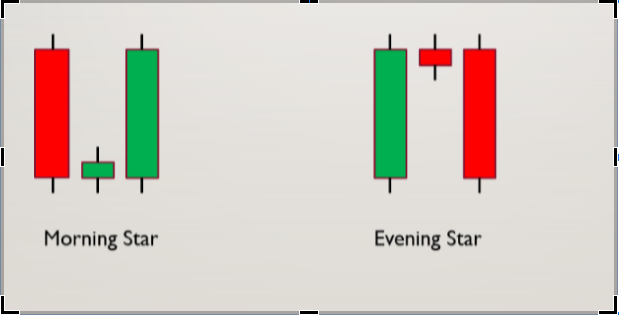
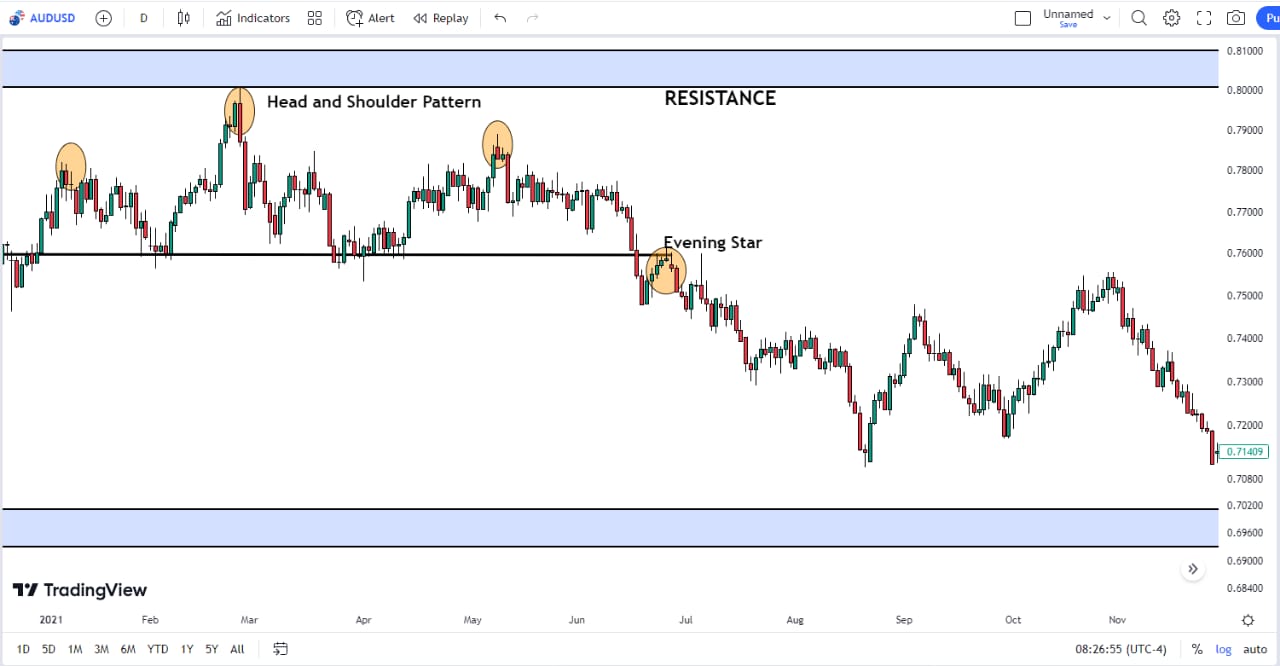
Morning and Evening Star:
These candlestick patterns are very reliable as they indicate a significant change in the direction of price when they are formed.
The morning star is formed when the price is about to change its direction to the upside, while the evening star candlestick pattern is formed when the price is about to change its direction downwards.
Those are my top 3 most profitable candlestick patterns.
You might be wondering, “Are these candlestick patterns enough to make trading decisions?” Definitely Not!
They are best used in conjunction with other trading confluences.
This leads us to another very crucial aspect, which is Chart Patterns or Chart Formations
Chart Patterns
Chart patterns are clearly observable recurring patterns formed by price, with a characteristic property when formed by any security.
This, in simple terms, means chart patterns form time and time again, and when they do, they tend to have a specific effect on price.
Chart patterns can be categorized into two types, these are;
- Reversal and
- Continuation chart patterns.
Reversal Chart Patterns:
These are chart patterns that, when formed, generally tend to change the direction of price.
This means if the price has been in an uptrend, the formation of a reversal chart pattern would ensure that the price begins a downtrend.
Examples are Head and Shoulders or Reverse Head and Shoulder patterns, Double tops and bottoms, triple tops and bottoms, etc.
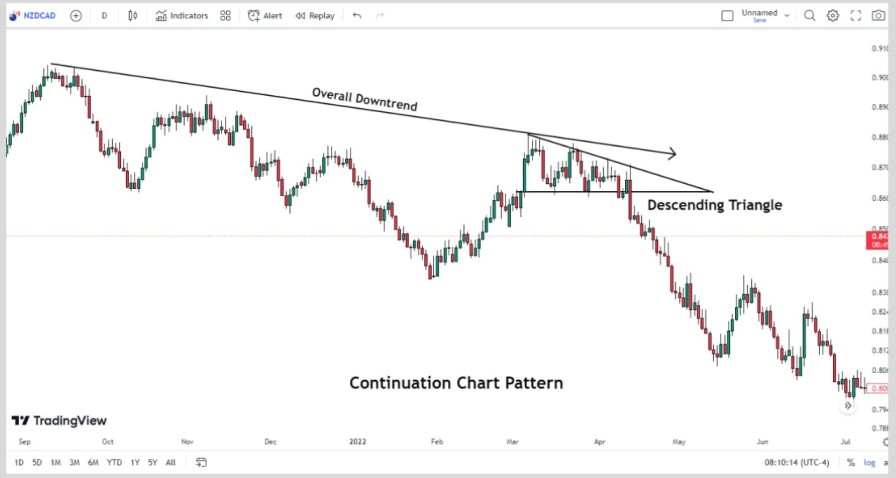
Continuation Chart Patterns:
From the word “continue”, these are chart patterns that are formed temporarily after an expanding phase.
They signal the continuation of an uptrend or downtrend.
Examples are Ascending and Descending triangles, Flags (which could be bullish or bearish), and pennant chart patterns, among others.
To guide you guys to start smashing the market as soon as possible, I would mention my top three (3) chart patterns, of which, when formed, the price reacts in a certain way.
Head And Shoulders Chart Patterns:
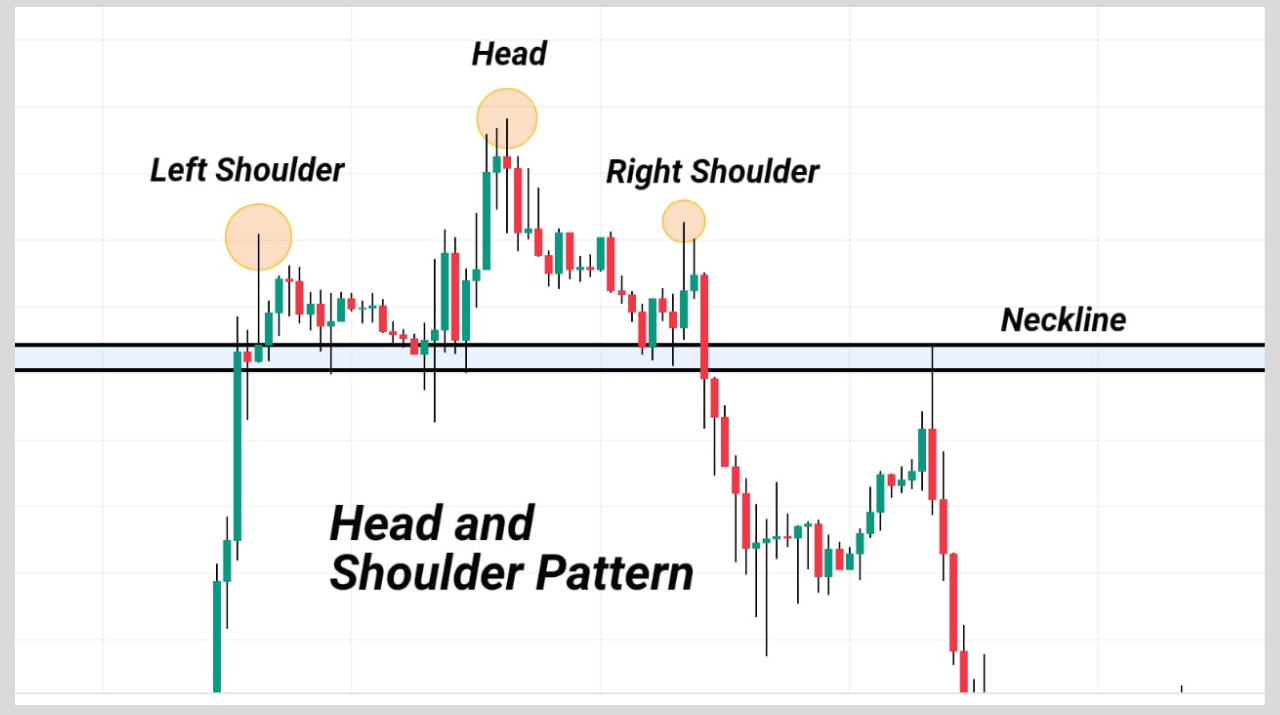
Coming at the top of the list, we have the Head and Shoulders Patterns.
As I have mentioned above, head and shoulders are reversal chart patterns which, when formed, price tends to change its trend.
This pattern is formed when the bullish trend of the price has been exhausted and is about to change its direction to the downside.
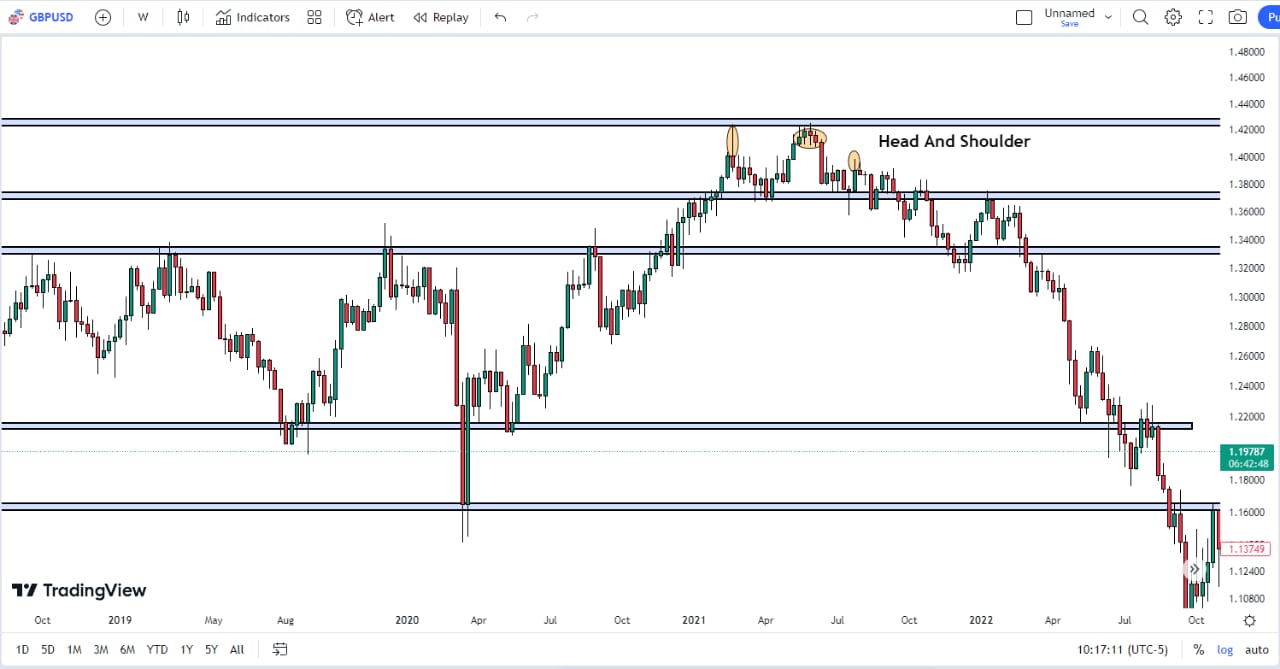
Do you notice how the price changed its direction after the uptrend?
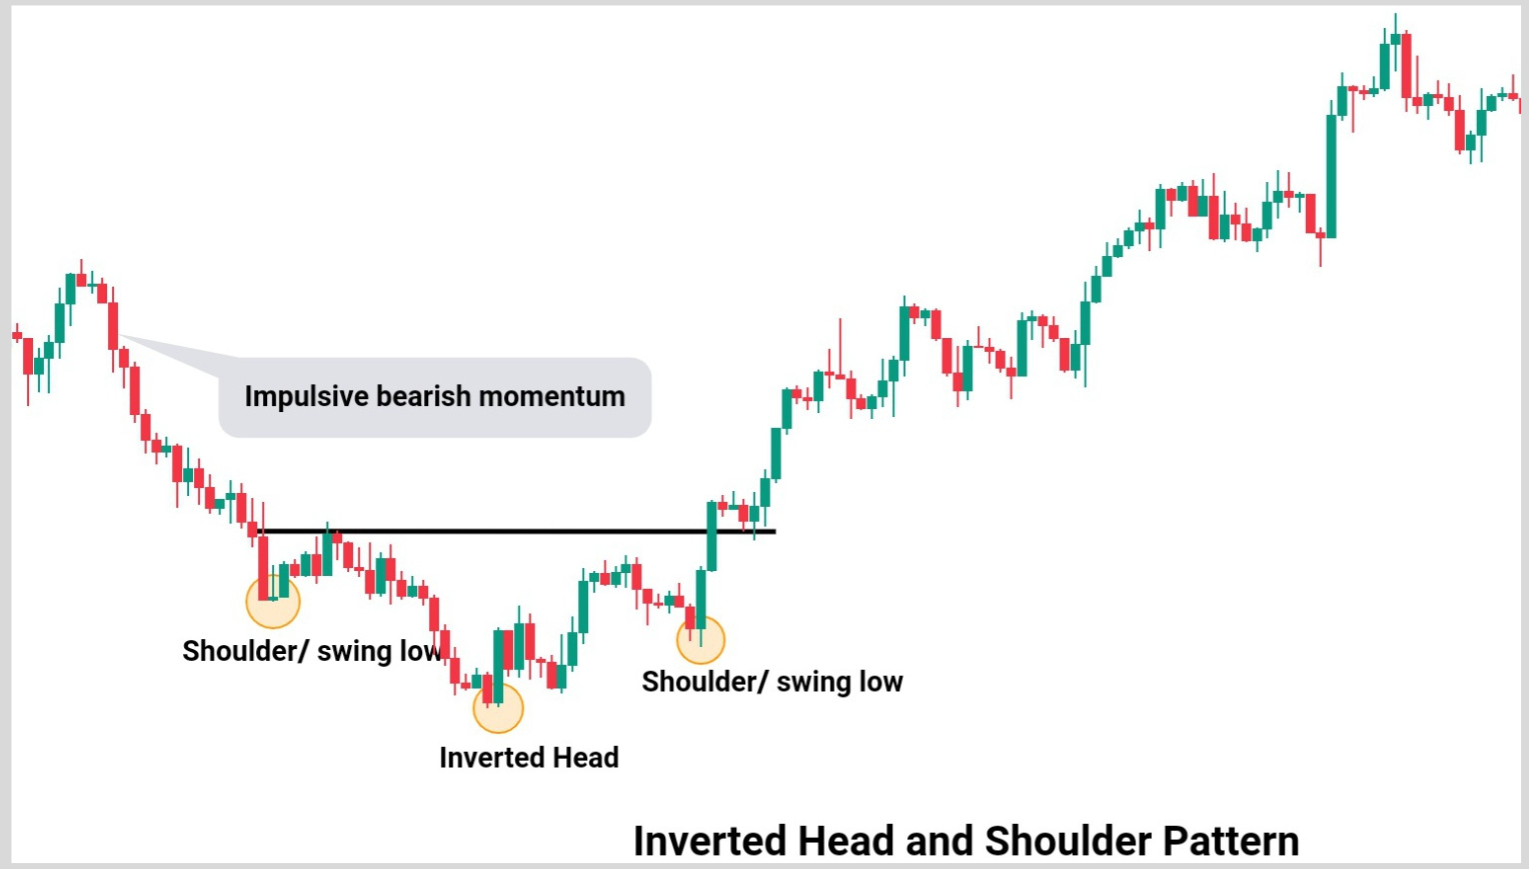
There is also a reverse case of this price action pattern that occurs when the price has ended its bearish phase and is about to change its direction to the upside.
This price action pattern is called the Reverse Head and Shoulders pattern.
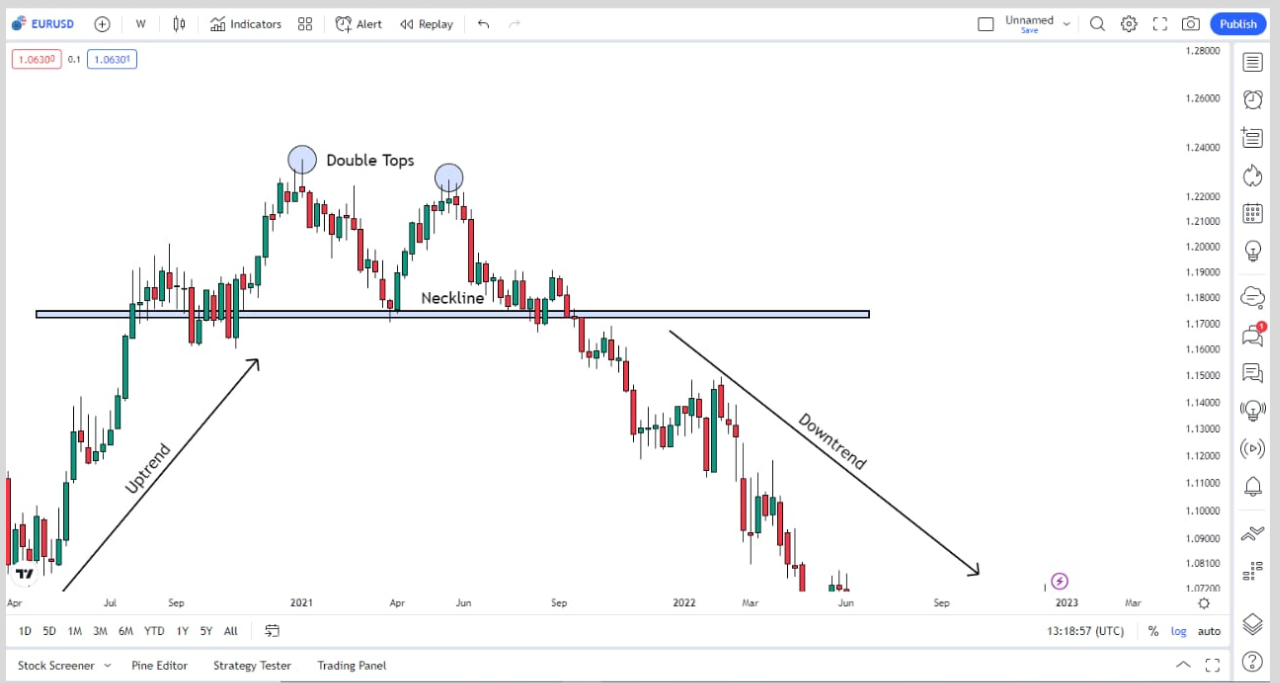
Double Tops and Double Bottoms:
Up next, we have the double tops and bottoms.
Double tops are reversal chart patterns that when formed result in a change in the direction of price.
They are formed when the price is about to change its direction from a bullish phase to a bearish phase.
Also, Double bottoms are formed when the price is about to change its direction from a bearish phase to a bullish phase.
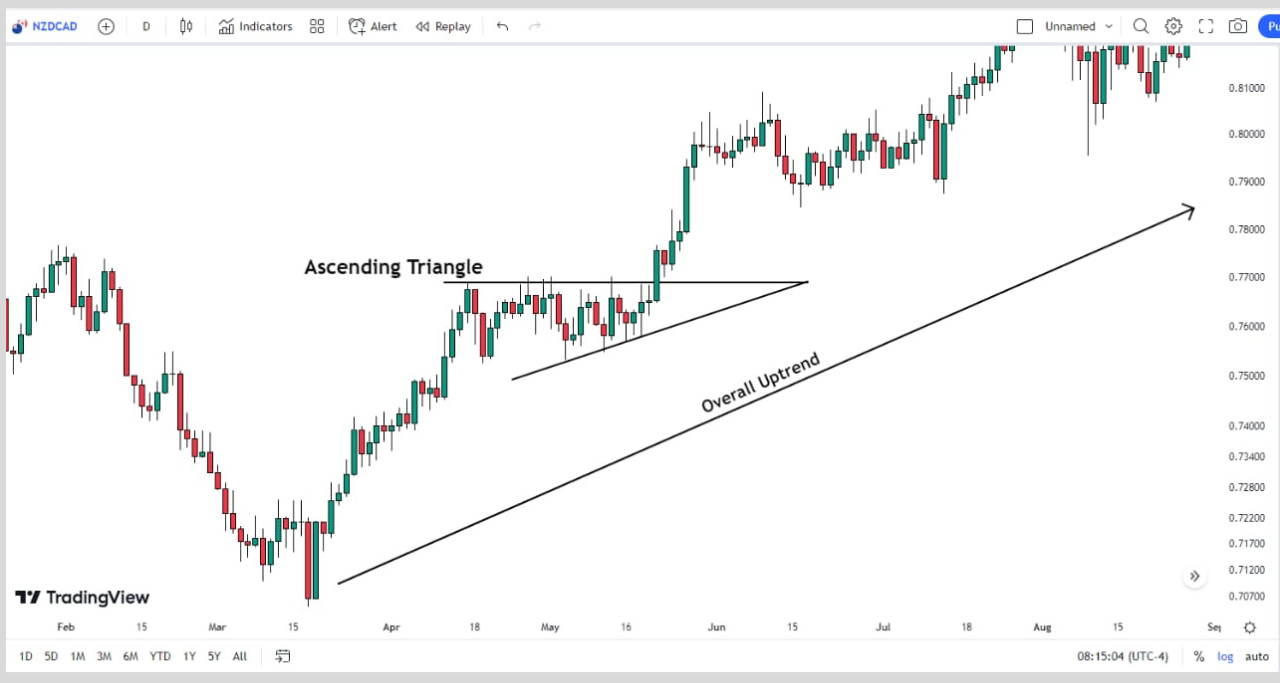
Ascending and Descending Triangles:
Coming at the third most preferred chart patterns, we have the ascending and descending chart patterns.
These chart patterns are forms of a continuation chart pattern, which, when formed indicates that the price is about to continue a trend that it was before the brief pause.
Ascending Triangles are formed when the price wants to continue its uptrend
Descending Triangles are formed when the price wants to continue falling in its downtrend.
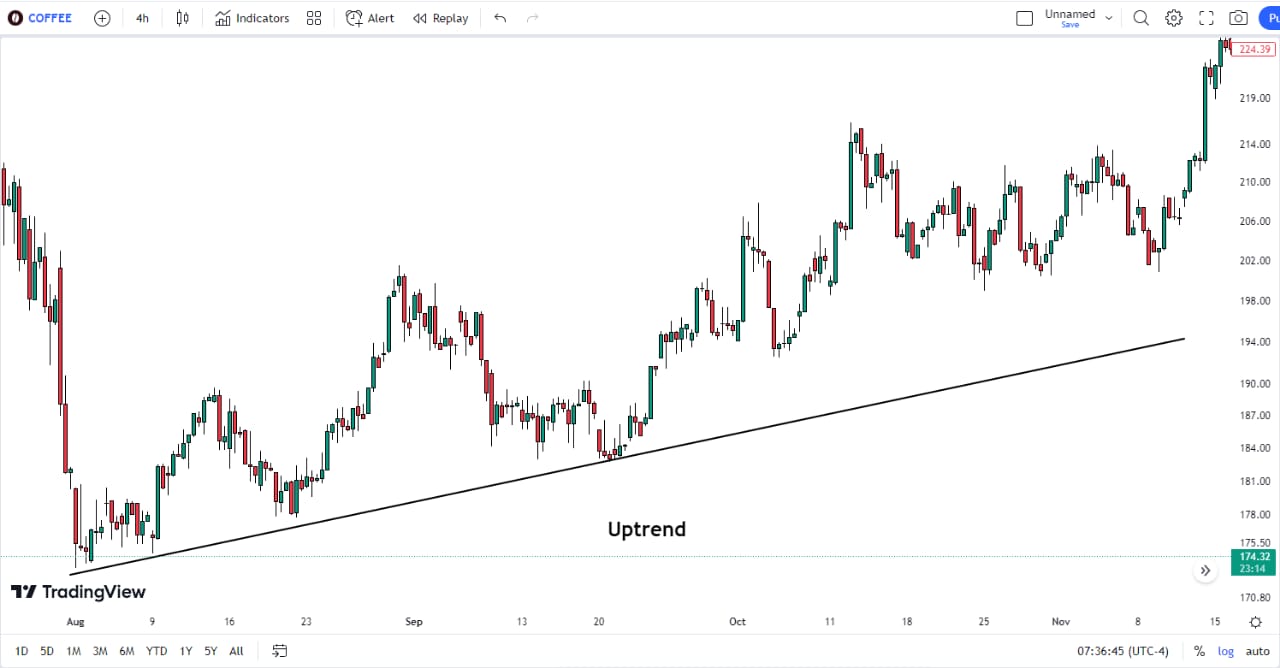
The last essential tip of price action that you would be learning is called Trendlines.
Trendlines
Trendlines are lines drawn to connect consecutive swing highs or swing lows together.
They are also used to identify the direction or trend of prices over a period of time.
There are two types of trendlines, which are;
- Bullish trendline and
- Bearish trendline.
Bullish trend lines are used to join consecutive swing lows together, and this trendline helps to show that the price is in an uptrend.
Bearish trend lines are used to join consecutive swing highs together and, hence, help to identify a downtrend.
That said.
At this stage, you have to know all the basic features for price action trading.
Now, you need to know how to use them all and implement them in your trading plan.
On this note, let’s look at different strategies that you can use in your trading using these essential tips that you’ve learned.
Price Action Trading Strategy
So I am going to show you how all these candlestick patterns, chart patterns, and support and resistance levels combine in the charts to make a well-trading decision
Strategy 1: Support + Swing low + Bullish Engulfing
Strategy 2: Trendline + Bearish Engulfing + Swing High
Strategy 3: Head and Shoulders + Resistance + Evening Star
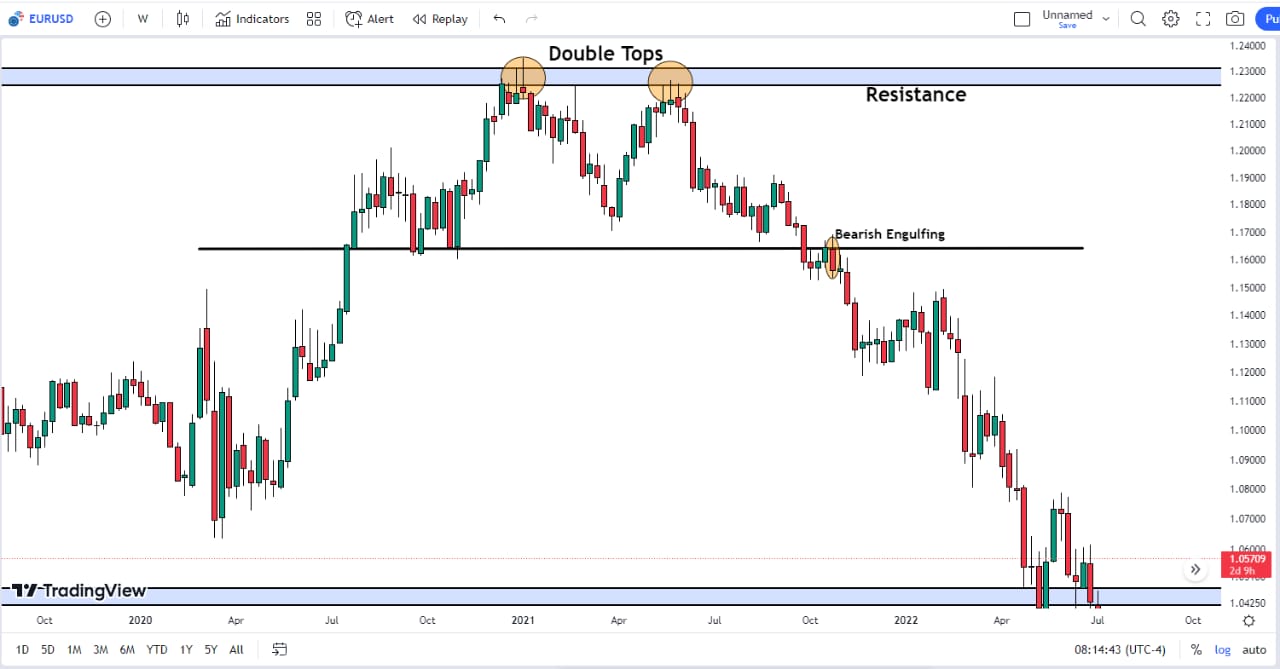
Strategy 4: Double Tops + Resistance + Bearish Engulfing
Summary
At this stage, you have to know the different techniques that are employed when trading price action.
You have learned what price action means, the essentials of price action, and how to trade price action using these essentials.
Now, here is what I want you to do for me…
Tell me what price action combinations you believe would be the best for you.
Learn More: Price Action Strategies That Work For Swing Trading