The Fibonacci retracement strategy is a valuable tool in trading that is used for confirmation of trade setups, to identify potential support and resistance levels, and indications of trend reversal or continuation.
But when used in conjunction with Price action trading.
The results? 90% Win Rate.
Key Takeaways
- Fibonacci retracement strategy combined with price action can lead to a 90% win rate in trading.
- Fibonacci retracement is based on a mathematical sequence where each number is the sum of the two preceding ones.
- Commonly used Fibonacci retracement levels include 38.2%, 50%, and 61.8%.
- These levels are drawn on price charts to identify potential support and resistance levels.
Experienced traders are well aware of the significance of the Fibonacci strategy in the world of trading, and it is a tool that traders simply cannot afford to overlook.
In today’s post, we will explore the use of the Fibonacci strategy with price action.
Let’s dive right in.
I Don’t Have Much Time.
Click Here To Download The Free PDF Guide Of This Post
What is Fibonacci Retracement Trading?
Fibonacci retracement is based on a sequence called the Fibonacci sequence, which is a mathematical set of numbers where each number is the sum of the two preceding ones.
It begins with 0 and 1 and goes on like this: 0, 1, 1, 2, 3, 5, 8, 13, 21, 34, 55.
E.g 0+1=1, 1+1=2, 2+1=3, 3+2=5, and so on.
In the world of trading, these Fibonacci retracement levels are used to measure the extent of a price correction after a significant move in price.
The most commonly used levels are 38.2%, 50%, and 61.8% Fibonacci.
E.g 21 divided by 55 resulting in approximately 0.382, which is 38.2%.
34 divided by 55, resulting in approximately 0.618, which is 61.8%.
These Fibonacci levels are drawn on a price chart using the Fibonacci tool, which is most available on every trading platform (TradingView, MT4, etc).
They are also used to identify key levels in a price chart.
A retracement level can act as a potential support level during an uptrend or a potential resistance level during a downtrend, and traders may use these levels to make trading decisions, such as placing buy or sell orders, setting stop-loss levels, or taking profit targets.
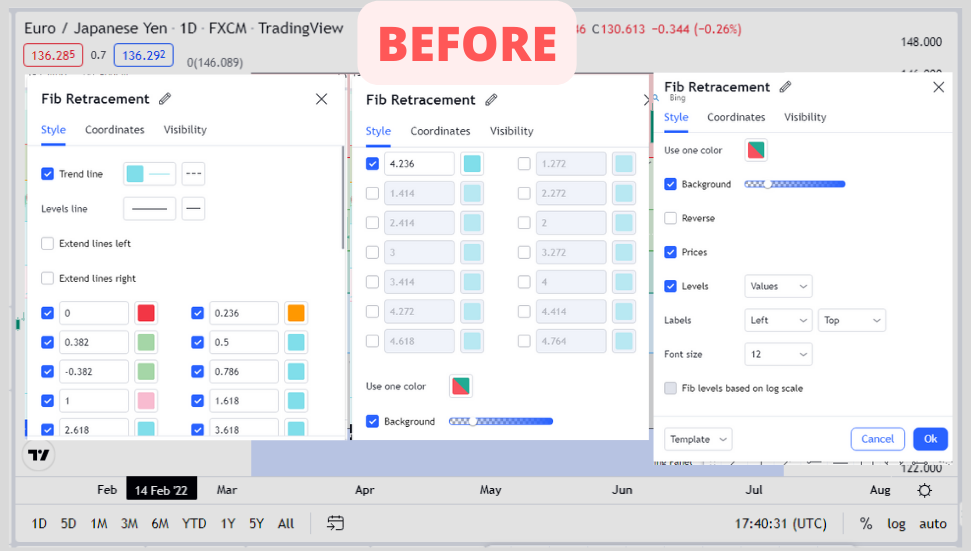
The Fibonacci Retracement Settings
The Fibonacci retracement settings are those specific ratios that are used in the Fibonacci retracement tool to draw these retracement levels on a price chart.
The most common Fibonacci retracement settings that tend to be significant to traders are:
- 38.2%: This is a popular ratio used in Fibonacci retracement trading. They are usually derived from dividing a number in the Fibonacci sequence by the number that follows it. (21 divided 55= 0.382).
- 50%: It is simply the halfway point between the swing high and swing low, and it is considered a significant level where the price may retrace. This level is not directly derived from the Fibonacci sequence, but it is a common ratio used in Fibonacci retracement trading.
- 61.8%: This level is one of the key Fibonacci ratios and is derived by dividing a number in the Fibonacci sequence by the number that precedes it (e.g., 34 divided by 55), resulting in approximately 0.618. It is also known as the “golden ratio” and is considered a significant level of potential retracement.
Apart from these (3) most common levels, there are other Fibonacci retracement settings that most traders usually end up using, they are 23.6%, 76.4%, and 88.6%. Although they are less commonly used.
With that, you don’t necessarily need to manually calculate the Fibonacci retracement levels yourself; your charting software has built-in tools that can automatically plot and calculate these levels for you.
Additionally, there are Fibonacci calculators available that can quickly calculate the levels with just a few clicks.
However, it’s still beneficial to understand the basic theory behind the indicator, not only for trading purposes but also to impress others with your knowledge.
Spoiler Alert: The above-mentioned Fibonacci retracement levels are not exact fixed values or rules.
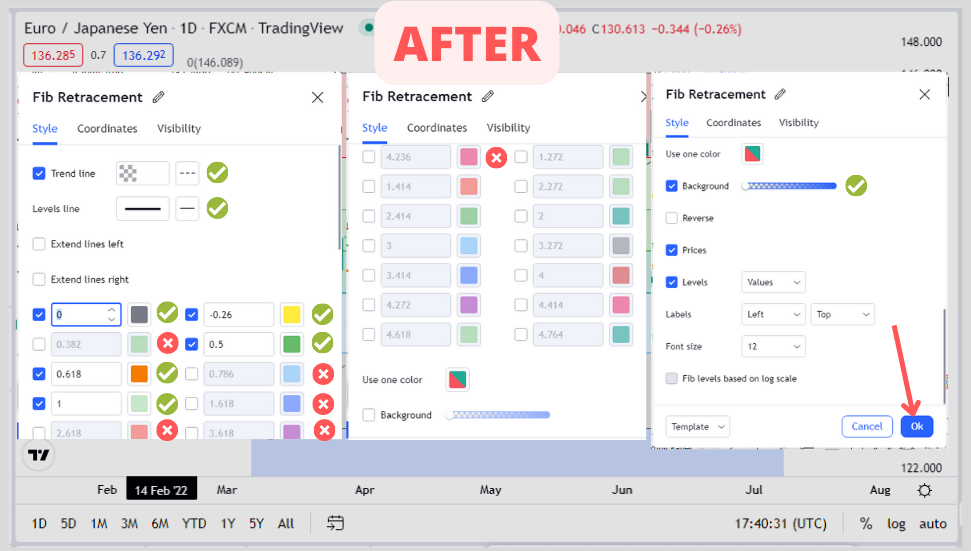
So as a trader, you may choose to customize the Fibonacci levels based on the market conditions, your trading strategy, and other personal preferences.
Some trading platforms, like tradingview allow the customization of Fibonacci retracement levels, allowing traders to use their preferred settings.
In addition to the retracement levels, traders may also use Fibonacci extensions, which are drawn beyond the swing high or swing low to project potential price targets.
Fibonacci extensions use ratios that are based on the Fibonacci sequence, such as 127.2%, 161.8%, and 261.8%, among others.
These extensions are used to identify potential areas where price may extend beyond the original trend, and they can be used in conjunction with Fibonacci retracement levels for a comprehensive trading approach.
How Effective Are Fibonacci Retracement Levels In Trading?
The Fibonacci sequence, proposed by the mathematician Leonardo Fibonacci, suggests that many aspects of human life and nature follow a particular sequence.
This mathematical theory (Fibonacci sequence) has found applications in various fields, including nature, life, and other mathematical concepts.
In trading, professional traders in the stock market have adopted Fibonacci’s mathematical formula to analyze the forex market.
They have found ways to incorporate Fibonacci retracement levels and other tools into their trading strategies, with promising results.
This application of Fibonacci’s theory has been a game-changer in the world of trading, providing traders with valuable insights and potentially enhancing their trading decisions.
To maximize the effectiveness of the Fibonacci retracement levels as a trading tool, it is most efficient when used in a trending market.
And we all know in a trending market, the price of a commodity or an instrument doesn’t just move like this.
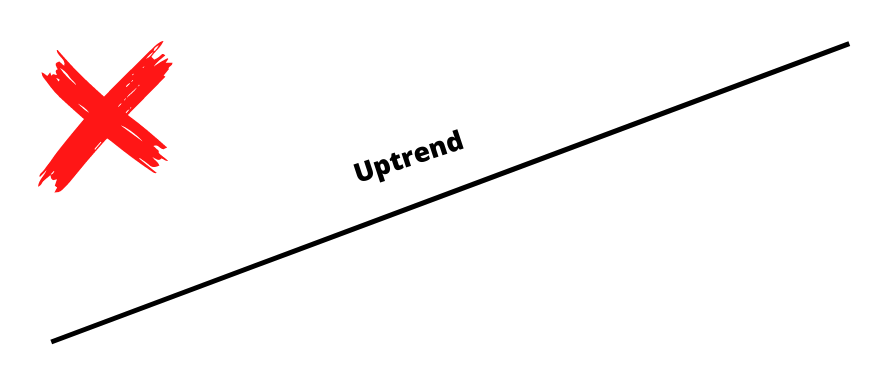
It moves in form of a waveform. higher highs, pullbacks, or retracements, and higher lows in an uptrend.
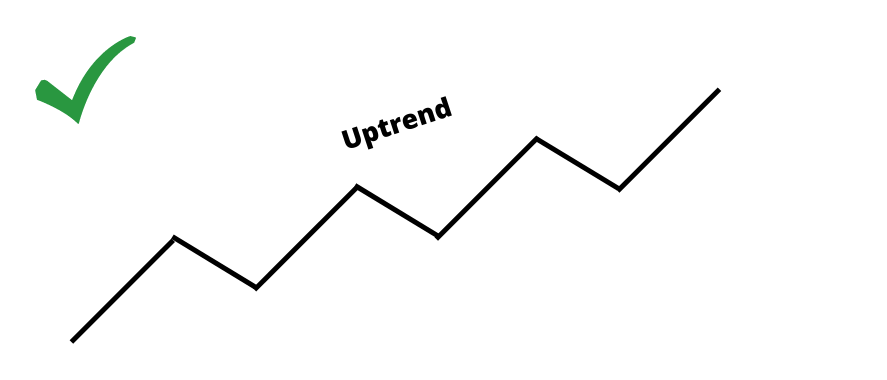
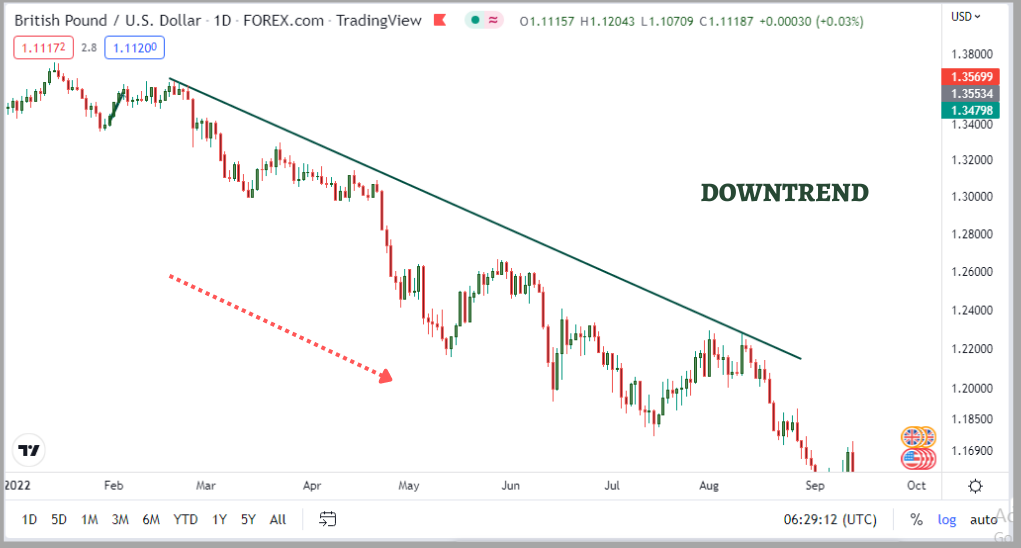
Or lower lows, bounces, or retracements, and lower highs in a downtrend.
Fibonacci can be used to identify potential entry points in a trending market by measuring the price swing from a swing low to a swing high, based on the sequential numbers in the Fibonacci sequence.
This can provide traders with insights into potential support and resistance levels and help them make informed trading decisions in the direction of the prevailing trend.
Now back to the question.
Does the Fibonacci Retracements Strategy Work?
The Fibonacci retracements strategy works when used in conjunction with price action, and I am a big fan of this tool.
For instance, when a significant number of traders are watching and trading based on the same Fibonacci retracement levels, it usually influences price action and results in reactions within those levels.
But it’s also important to note that these levels do not guarantee accurate predictions.
That is why it is advisable to use Fibonacci levels in conjunction with price action and other preferences.
Because Prices on the charts are usually influenced by multiple factors like economic data, technical and fundamental factors, geopolitical events, and others, etc. Which can negate the significance of these retracement levels in Fibonacci.
How to Use the Fibonacci Retracement Strategy With Price Action
Fibonacci retracements help you spot potential and identify profitable trading opportunities.
But when combined with price action, the result? 90% Win Rate.
To get started:
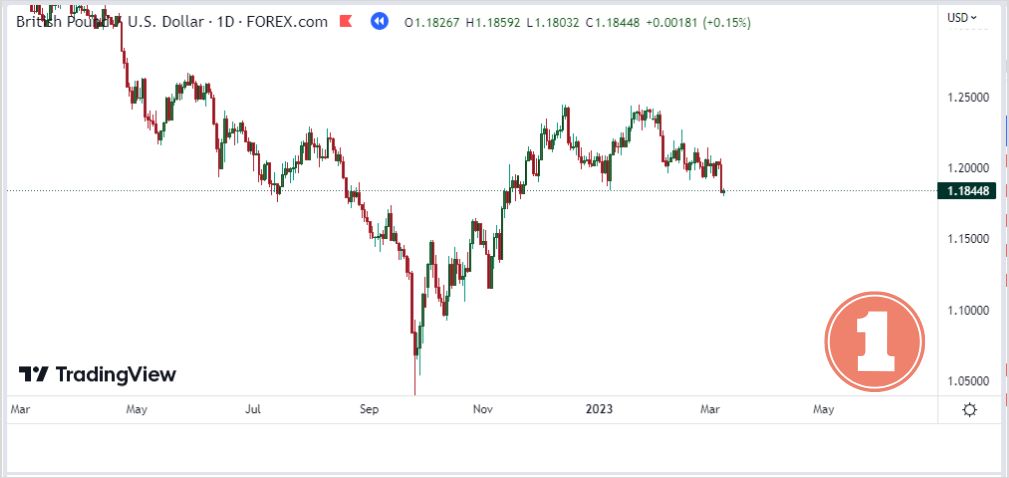
Step #1: Identify a Trend
Let’s face it, trading with the trend can be your best ally, as it allows you to capitalize on profitable opportunities in a market that is clearly moving in one direction.
And the same principle applies when using Fibonacci retracement in your trading strategy.
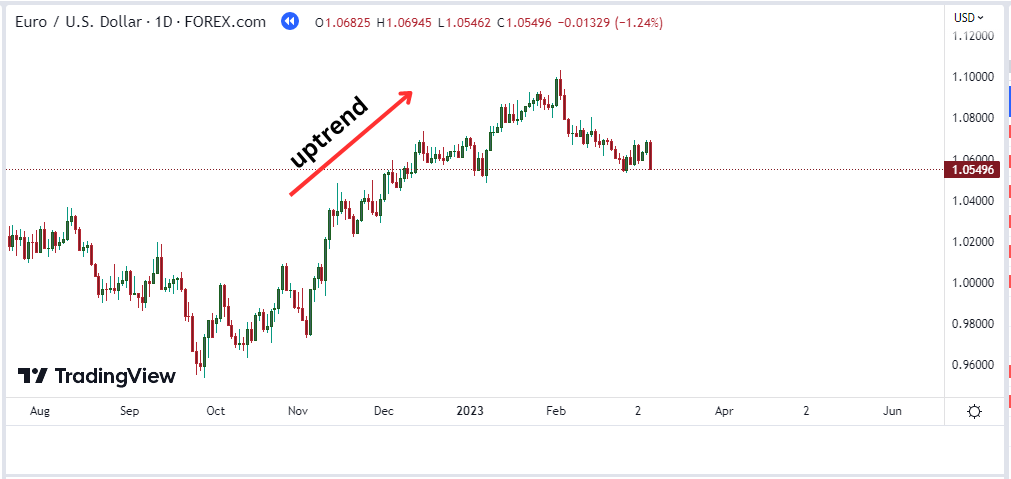
For this instance, we are in an uptrend as you can see.
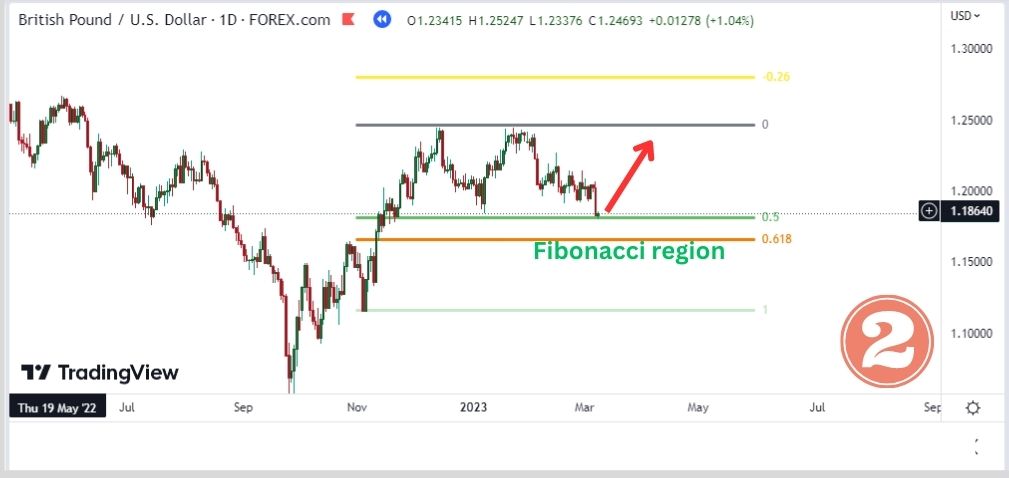
Step #2: Apply the Fibonacci Retracement Tool
Locate the intermediate swing Highs and lows in that trend. In this case, it was an uptrend.
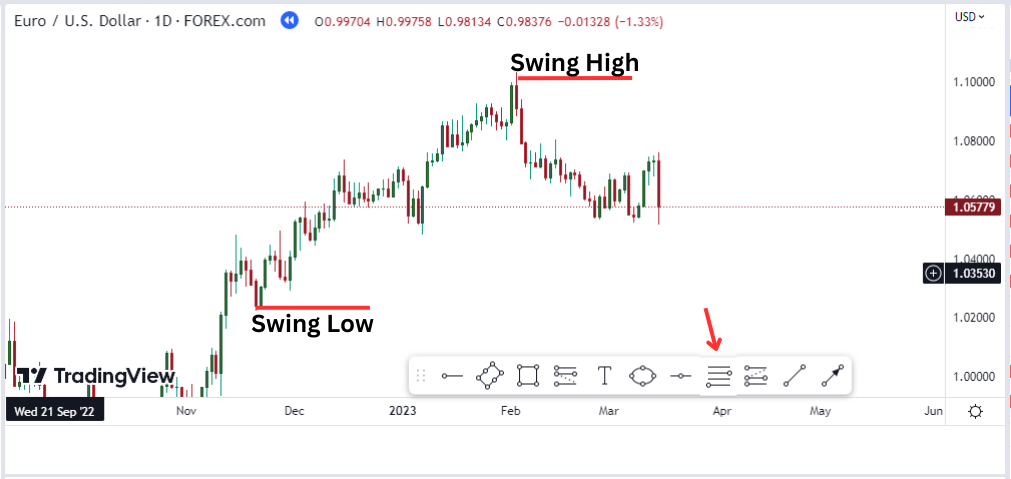
Apply your Fibonacci tools from swing low to swing high
The most significant are 50% and 61.8%.
You can also learn how to set up your Fibonacci on TradingView charts like mine.
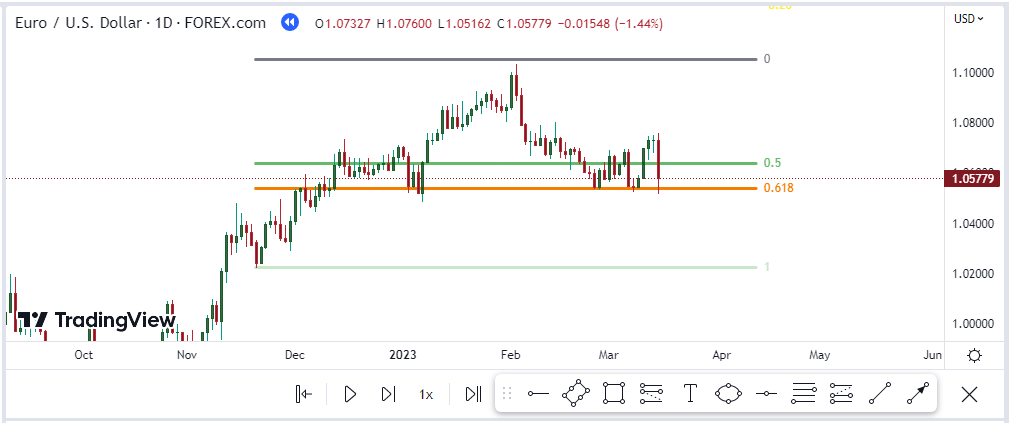
Step #3: Identify The Fibonacci Retracement Levels
The Fibonacci retracement tool will automatically plot several horizontal lines on the chart which represent different retracement levels, such as 0, 0.5, 0. 618, and 1.
These are the most significant turning points on the Fibonacci retracement levels.
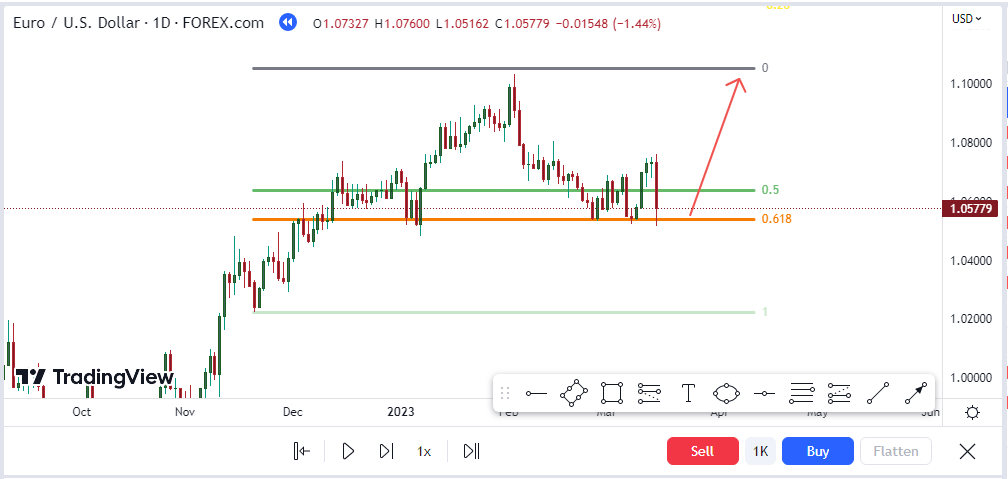
They indicate potential areas of support where the price may retrace before continuing in the direction of the trend.
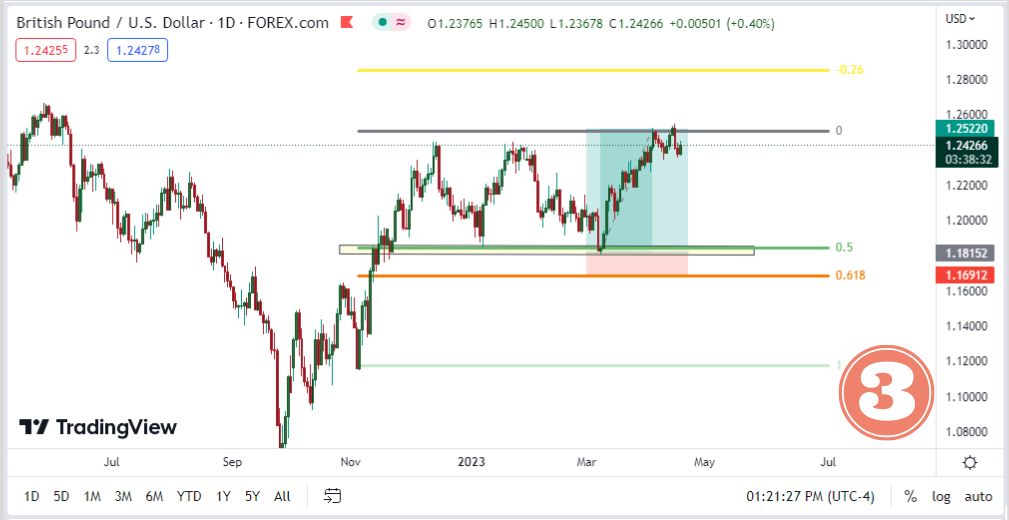
Step #4: Draw The Key Levels On That Region
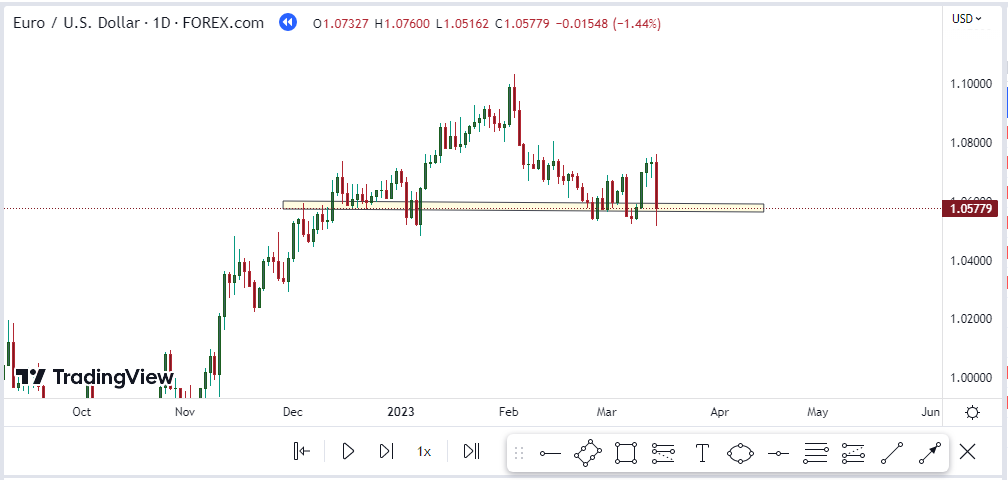
If you notice any price action patterns, reactions, such as the price bouncing off a retracement level or pullback, forming bullish or bearish candlestick patterns, or showing signs of consolidation or reversal.
This usually shows an additional confirmation of potential support or resistance levels based on the Fibonacci retracement levels.
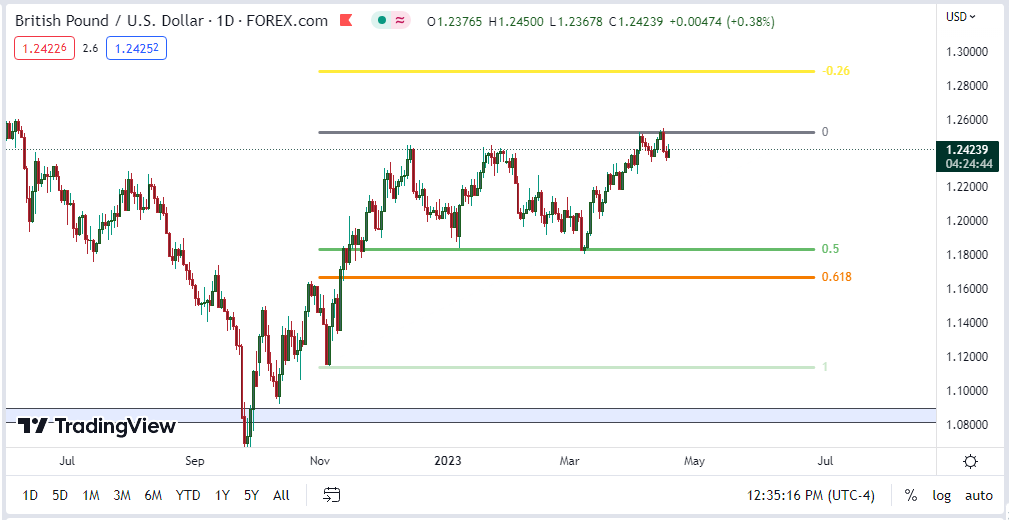
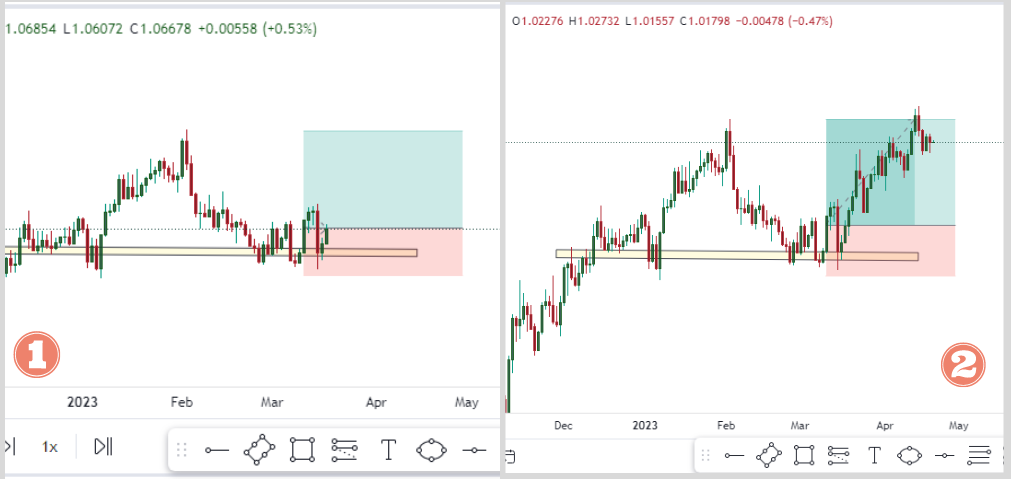
Step #5: Wait For An Extra confirmation
That extra confirmation could be anything, a price reaction (bounce above support).
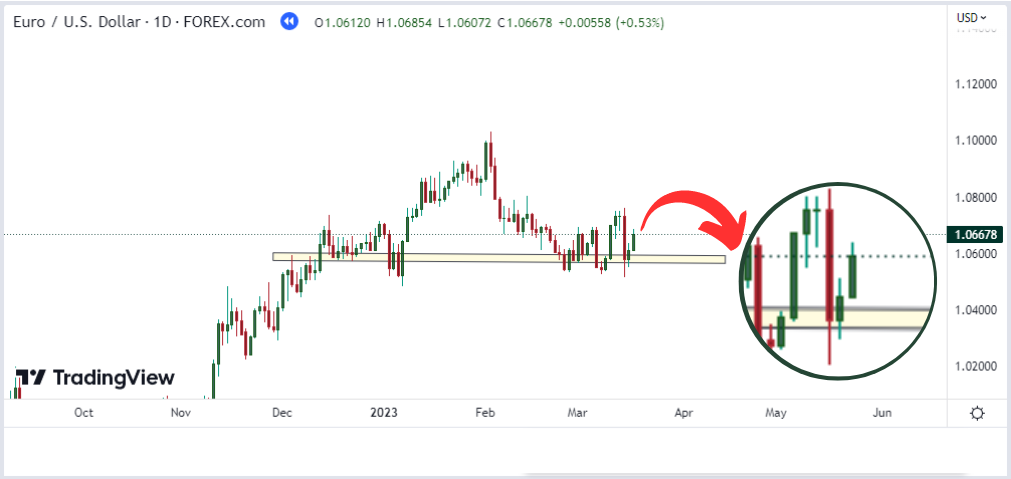
For example, if the price bounces off a retracement level and shows bullish price action, such as a bullish engulfing pattern or a hammer candlestick, it may be a signal to enter a long trade.
Good luck.
Learn More: How To Do Trading Backtesting
Disclaimer
This content is for educational purposes only and does not constitute financial advice. Forex trading involves significant risk, and past results do not guarantee future performance. Always do your own research and trade at your own risk.