When price makes a significant rejection in an upward area, it becomes potential support (supply).
The reverse is the case when it is a downward rejection, then it becomes a potential resistance level (demand).
And You may be wondering
Can you trade at the break of these support and resistance levels?
And the answer to this question is not what you thought it seems.
Spoiler Alert: Support and resistance lines are not just mere lines you draw on your charts ( i was a victim of this approach, during my early period of trading).
Psychologically we believed when the price meets those lines, it is expected for the price to make a quick rejection at those lines.
But what if the price didn’t make rejections on these lines, Does that means your lines are invalidated?
Or your lines aren’t placed or drawn correctly?
In other words, Support and resistance aren’t just lines drawn out of thin air.
“They are significant areas where prices are most likely to be rejected“.
So in today’s guide.
Am going to uncover the real myths behind support and resistance.
And how to locate support and resistance areas in forex with an 80% success rate
Things to look out for before drawing your support and resistance levels, and lastly
How to use those areas to get a better entry and exit point in the market (from my 12 years of trading experience)
The Good parts: This guide works for all financial markets.
In continuation of this article, a good background knowledge of what drives the market would not be a bad one.
Wouldn’t you agree?
Yes. It would be necessary.
That’s what leads us to the first section of this article.
Supply And Demand
In the fundamental world of market analysis, the words supply and demand are often used rather than resistance and support.
In this section.
We would be using the words supply and demand to refer to our conventional support & resistance levels respectively.
For the sake of clarity, as pointed out earlier on, Supply means “Resistance“.
And Demand means “Support“.
Supply and demand are terms used when it comes to buying and selling any terms in the financial markets.
Thus, we can safely say, “they are the major drivers of any financial market”.
Investors or traders who have a sound understanding of the market and its dynamics are better prepared for any outcome in price action.
Although fundamentals are more of a theoretical approach to the market than just understanding price action.
And that isn’t enough to create a series of price movements in the financial markets.
But as trading is concerned, the market is always 100% technical.
So enough of fundamentals.
Let’s go into our technical approach and see how we can bring that understanding into the technical aspects of the chart.
A supply level is referred to as a zone where the price seems to have been overbought.
In other words, A zone where the buying pressure of the market is already perceived to be too much.
Due to this perception from most traders or investors, that level is where many would be to looking for selling opportunities (bearish positions).
Hence, it is called the “Selling Zones“.
Also, when there seems to have been a decline in price, there would be a time when demand would rise.
Therefore, the demand level is described as a zone where the price seems to have been oversold.
In other words, A zone where the selling pressure of the market is already perceived to be too much.
When other traders or investors see these common phenomena of the market, they would look for buying opportunities (Bullish positions)
So, it is referred to as the “Buying Zones“.
But that is just one part of it.
Knowing how support & resistance zones can help you decide a well-informed trading decision based on those levels or zones.
And it usually begins with this question, how can I identify supply and demand zones on my chart?
That leads us to the next paragraph.
How To Identify Support & Resistance Zones
As mentioned earlier on.
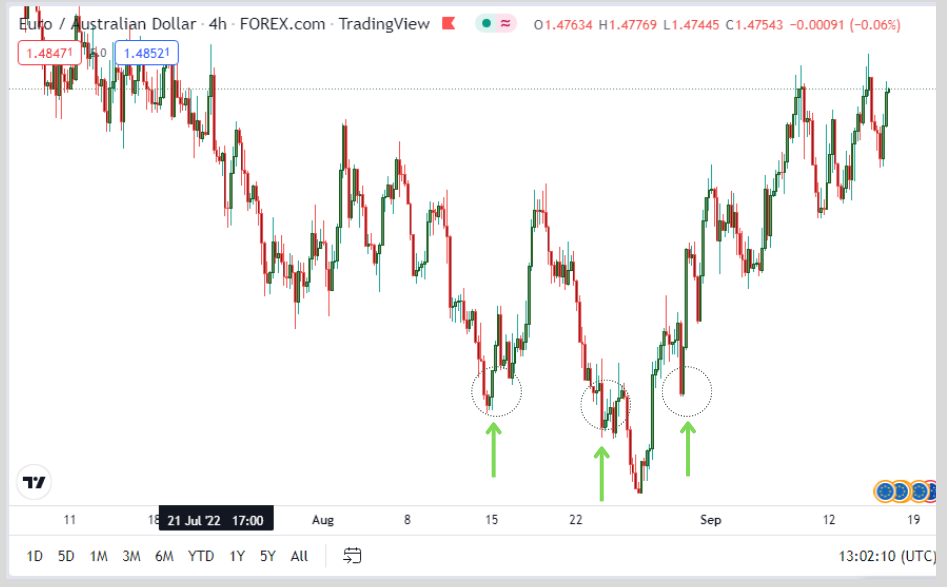
Support and resistance are not just lines drawn out of the thin air, they are areas where there is a decline in price movements.
I can explain.
As shown below, the price makes a quick rejection on EURAUD, which indicates a potential resistance level.
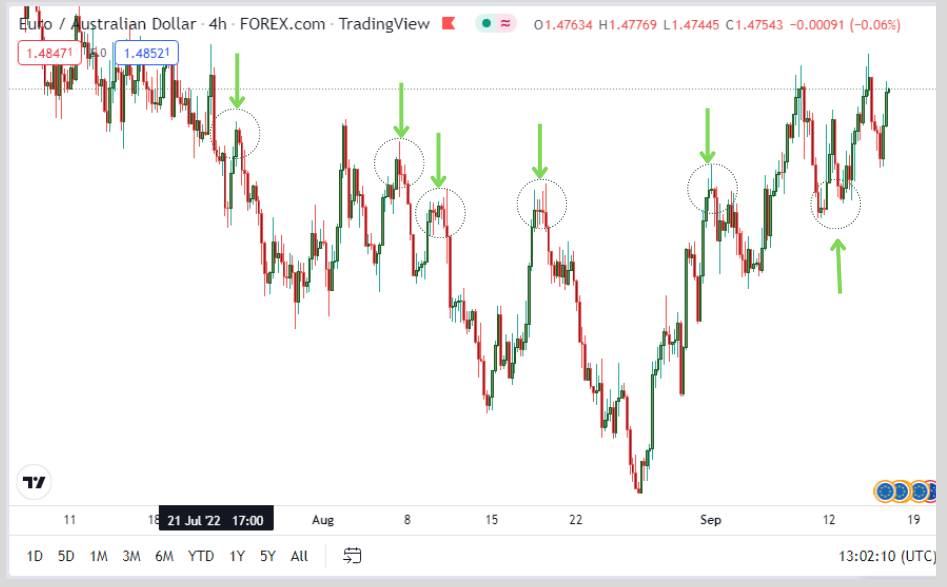
Why does this happen?
Due to the fact that the market is reluctant to move above or below that level.
According to experience,
There is a high possibility price may reject when it meets major zones (more on that later).
How To Draw Support & Resistance Zones
Knowing how to draw support and resistance the right way will save you a lot from
- Premature trades
- Fakeouts or false breakouts and also,
- Helps you determine your entry and exit point, Area of value in the markets.
Which shows how important support and resistance zones can be.
In fact, it is usually the first approach to take when you are to analyze the forex markets.
But drawing these SR (support and resistance) zones varies, especially in terms of multiple time frame analysis.
For example,
On the monthly time frame, you tend to see the bigger picture of the overall trend.
I can explain
Price moves into 3 categories
- Uptrend (higher highs and higher lows)
- Downtrends (lower highs and Lower lows)
- Range
As every trend trader says, “The trend is your friend”
This means you either jump into the markets when it trending lower (bearish) or higher (bullish).
This approach perfectly works well for me as I am also a trend trader (more about me)
In other words, I stay out of the ranging markets.
Check out this practical scenario using EURAUD to justify my analysis.
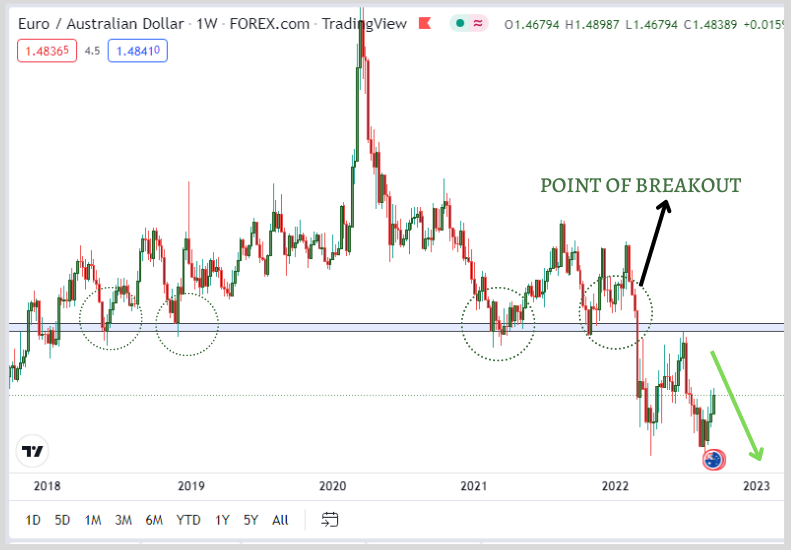
On the monthly time frame, we could notice the following options.
The market has been in an uptrend way back since 2013 and now ending its uptrend movement in late 2021.
And that resulted in a break in the overall trendline drawn from the start of the trend to the point of intersection as shown below (using a dotted circle as an indicator).
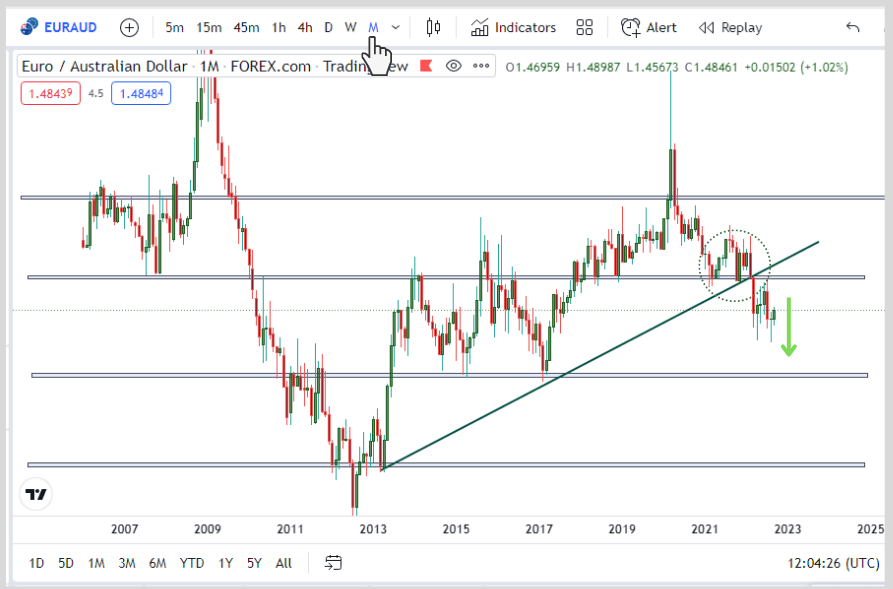
Price broke the trendline and started heading in a downward direction, opposite to the overall bullish trend.
Judging from my analysis.
We anticipated the price next level target to be the next support level (as indicated with the green arrow above).
But when we go on Lower timeframes (daily for this purpose), we notice a different move in price.
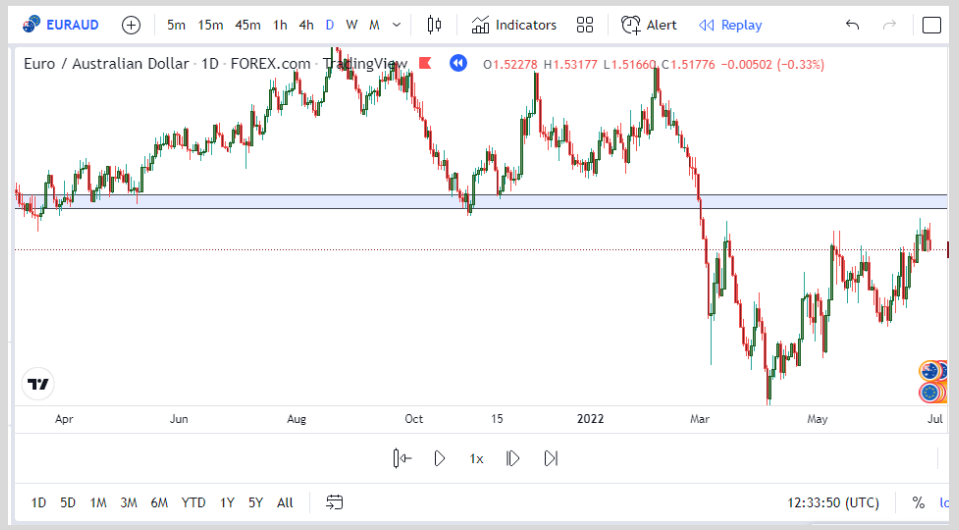
Price was moving in the opposite.
Now if you are on lower timeframes, you would have gone for a buy only for it to go as what the monthly TF says.
Keynotes: The monthly time frames show you the bigger picture.
With that, there is also a need to identify support and resistance zones on a higher time frame like this.
And that can be categorized into (2) aspects.
They are;
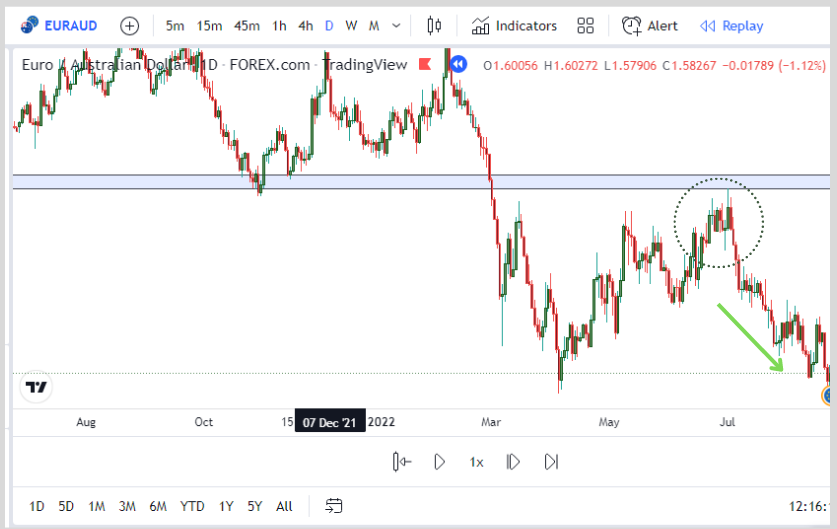
Major Zones:
These are overall support and resistance zones that are drawn on a higher timeframe (monthly/weekly timeframes).
They indicate the overall pictures of price rejections and these zones are always significant because they are drawn on higher timeframes.

I usually indicate them with light blue color on tradingview
Minor Zones:
They are minority support and resistance zones that are usually drawn on lower timeframes and they help in determining a better trading execution on lower timeframes.
I usually indicate these zones with a yellow rectangular block on tradingview tools.
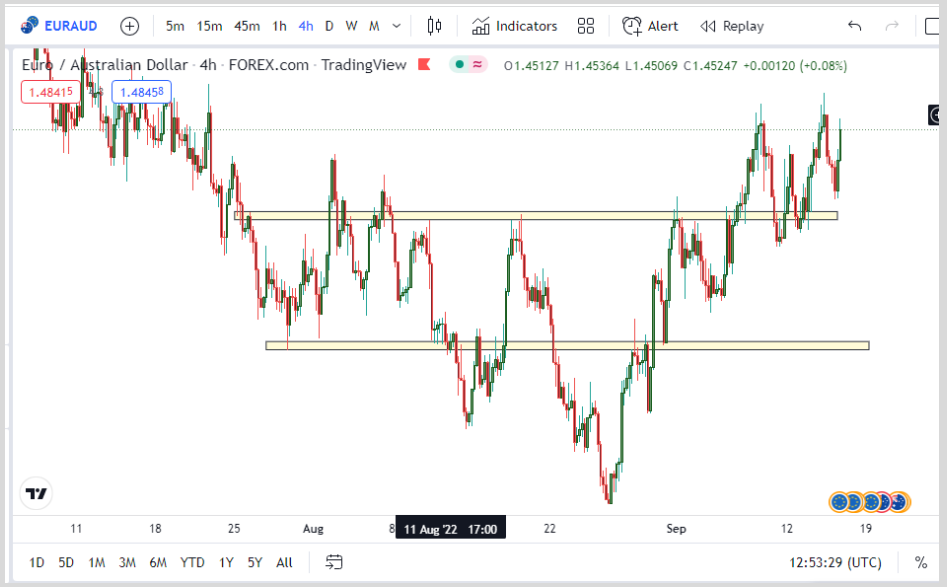
The minor support and resistance are not as significant as the major zones and can also be affected by noise in the markets such as News and Market Manipulation (Stop Hunting).
You should therefore not trust their validity until proven.
Pro Tip: The Major zones are the most significant zones you should always watch out for.
To draw The SP Zones
Identify areas on the charts where prices make multiple rejections in the past.
If at the top, it is resistance, and below, then it is support
Pro Tip: The more rejections the price encounter on that level, the more significant it is.
Draw a line (major or minor zones) touching the areas where prices make those rejections in a serial or straight-line manner.

And there you have it.
Don’t sleep on This
The more price hits a certain level, the more significant that level is, either support or resistance.
But that doesn’t mean, that price must make a V-turn in the opposite direction when it gets to these levels.
In most cases, price tends to breakouts off these zones and then continue their trends, making those zones invalidated.
The reality behind it is just that they are lines that can always be broken.
Your ability to determine when the price is about to break a level or not should be based on your trading strategy.
So in other words.
Use this in line with your strategy and enjoy the best version of it.
Types Of Support & Resistance
There are two types of support and resistance I would like you to know.
1. Horizontal SR
2. Dynamic SR
Moving forward, Support and Resistance would mean SR.
Let’s explain the types of support and resistance mentioned earlier.
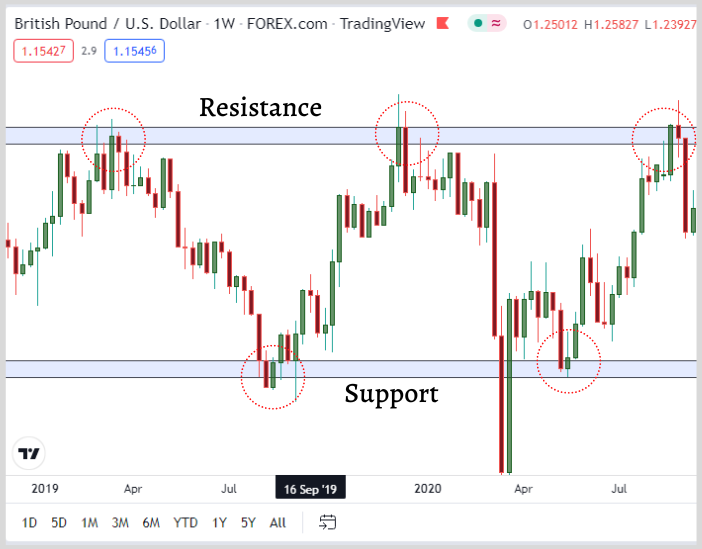
Horizontal SR:
From the beginning of this article, the major SR zone that has been discussed is the horizontal one.
Therefore, for the purpose of definition, the horizontal SR zone is a level where prices constantly test and bounce back from the same horizontal level.
Below is a chart example.
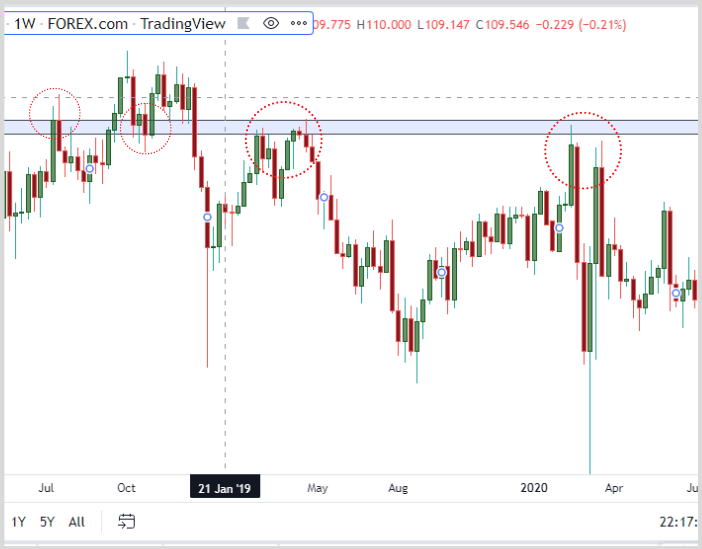
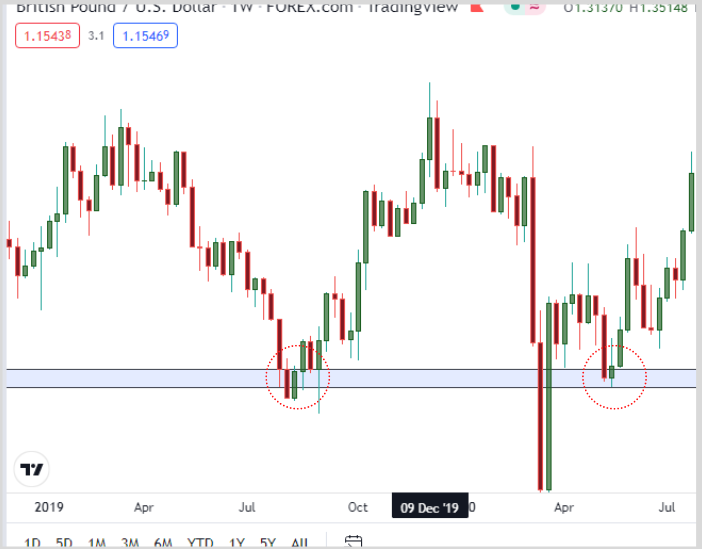
Down below is a typical example of a resistance zone.
Notice how the price bounces back from that same horizontal level. Hence, its name
Horizontal SR zone.
This leads us to the next, which is
Dynamic SR:
As its name implies, dynamic SR can be defined as a zone where price reactions are in form of a slant or dynamic manner.
This means that the price reacts at a certain level in a diagonal form.
Below is a chart example of a trendline acting as a Support.
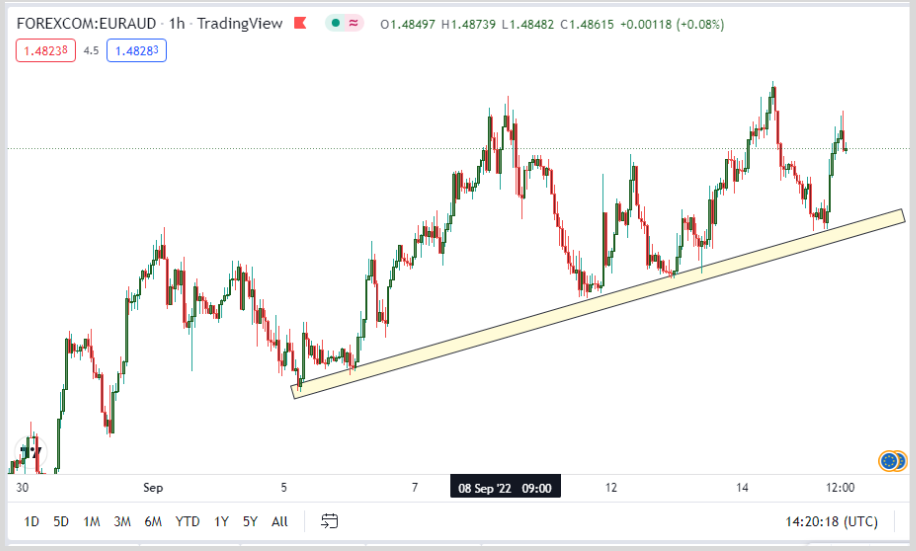
And the other, as a resistance.
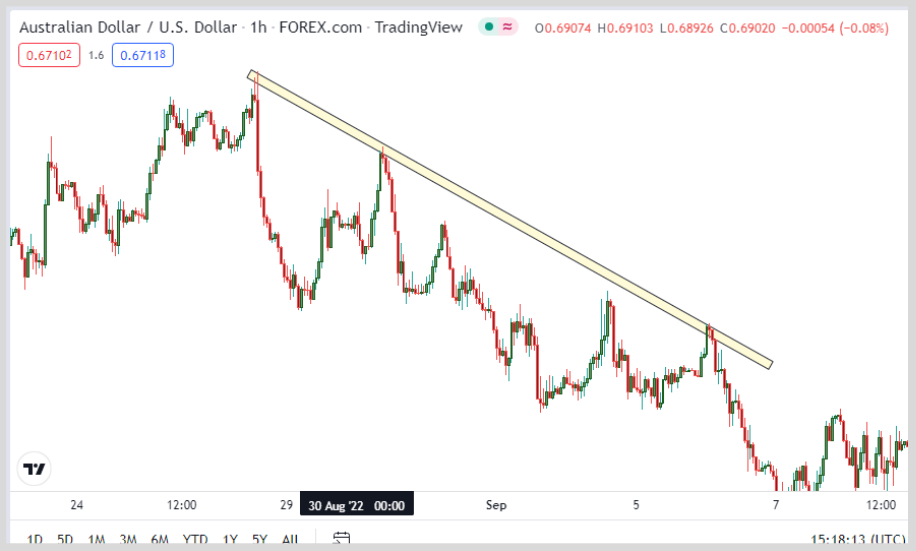
How do you identify this dynamic level of support and resistance?
Well, this is as easy as ABC…
If you have been conversant with my articles, I make reference to the use of trendlines.
Trendlines help to identify dynamic SR levels on the chart.
We would be using what is called the Rotating Rectangle and trendline.
This helps to properly identify the SR zones (not lines).
To identify your dynamic SR zone, just draw your rotated rectangle and trendline through the levels (learn more on how to use tradingview).
Having learned all these, let’s take into consideration some things to take conscious note of when drawing your support and resistance level.
- SR is an area or a zone, and not a line as some may say. If SR is considered a line, it would be made invalid by every spike through it.
- Too much testing of the Support and Resistance zone over a short period of time (e.g. the minor level) would render the level weak and can be broken at any time.
- This means that the more test on a level (over a short period ) the weaker it becomes.
- Many gurus tell you to set your stop loss above the support or resistance level.
But I will advise you not to heed that.
The reason because Many stop-loss that is set at major levels is subjected to market manipulation and stop-hunting.
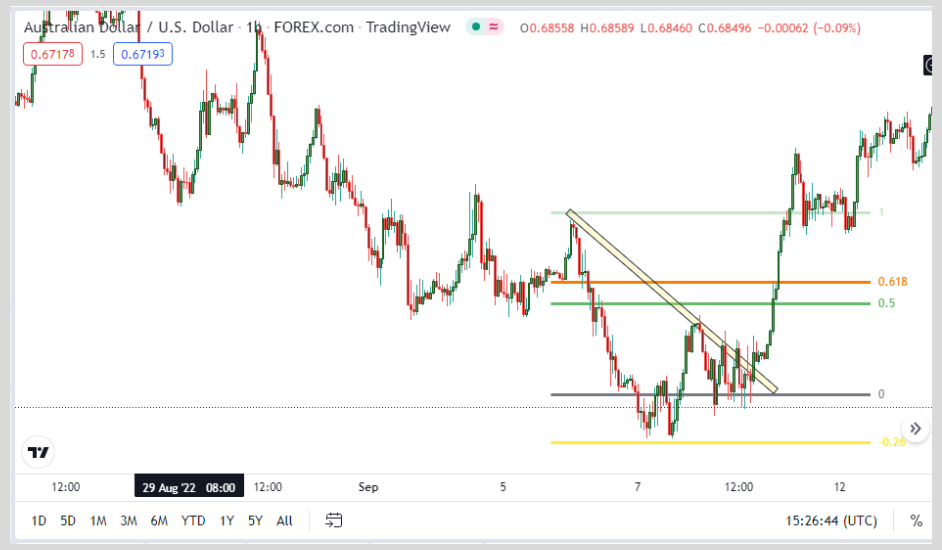
To set your stop loss, you can deploy the use of the Fibonacci Retracement tool to assist you, as shown in the example below.
Now, how do you use Support and Resistance to your advantage?
This leads us to the next section.
How To Trade Support & Resistance (Back-Retest Strategy)
In this section,
I would be unveiling to you a golden strategy that you can use or possibly add to your trading strategy.
This strategy is the “Break & Retest Strategy”.
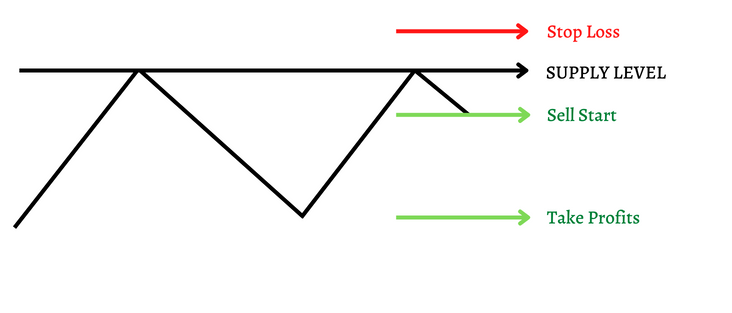
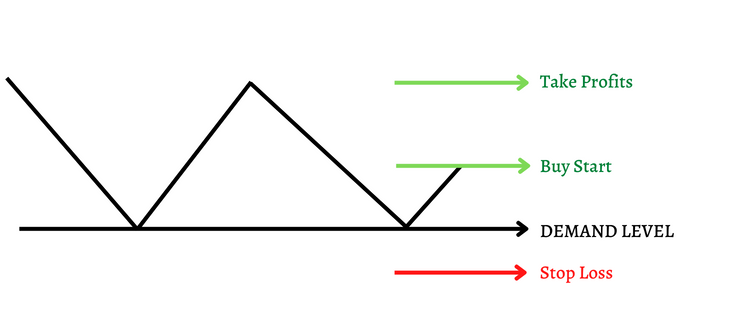
To use this strategy, you only need to follow a 5-step analysis to scoop money from the market.
- Identify your support or resistance level as the case may be. In this case resistance.
- Wait for a break of structure from that level.
- After the break of structure, you need to be patient enough to wait yet again for the retest of that level.
- At that level identify a complete formation of a reversal candlestick such as the engulfing candles.
- Then place your trade and set your stop-loss above the high of the reversal candle,
Or use the Fibonacci Retracement tool as explained earlier.
Set your take-profit strategically using a candlestick or the Fibonacci Retracement tool also.
FAQ
How To Determine Strong Support and Resistance in Trading?
Strong Support and resistance levels are determined by the amount of price rejection in major zones.
Minor zones, are less significant.
Can You Trade Without Support And Resistance Level?
No, you can’t do without trading support and resistance level, because they determine your entries and exist on the markets.
Conclusion.
In this article you have learned:
⦁ Supply and Demand
⦁ Support and resistance
⦁ How to plot your major levels and minor levels
⦁ Types of Support and Resistance, and
⦁ The strategy you can use with support and resistance.
Over to you guys now how do you use support and resistance in your trading strategy?