You always hear Trader say,
“The trend is your friend”,
“Trade the trend” … and so on and so forth.
But how exactly do we trade the trend and how do we make the trend our friend so as to profit from it?
The answer is simple, “Trendlines“.
Yes! As simple as that.
That is why in this article.
You would learn about trendlines and their types.
How to draw trendlines, and how to effectively use them to your advantage.
Without further ado, let’s dive right in.
What Are Trendlines?
Unlike support and resistance, trendlines are easily noticeable linear or straight lines drawn by traders to connect at least two price points that extend into the future.
They can be drawn by connecting,
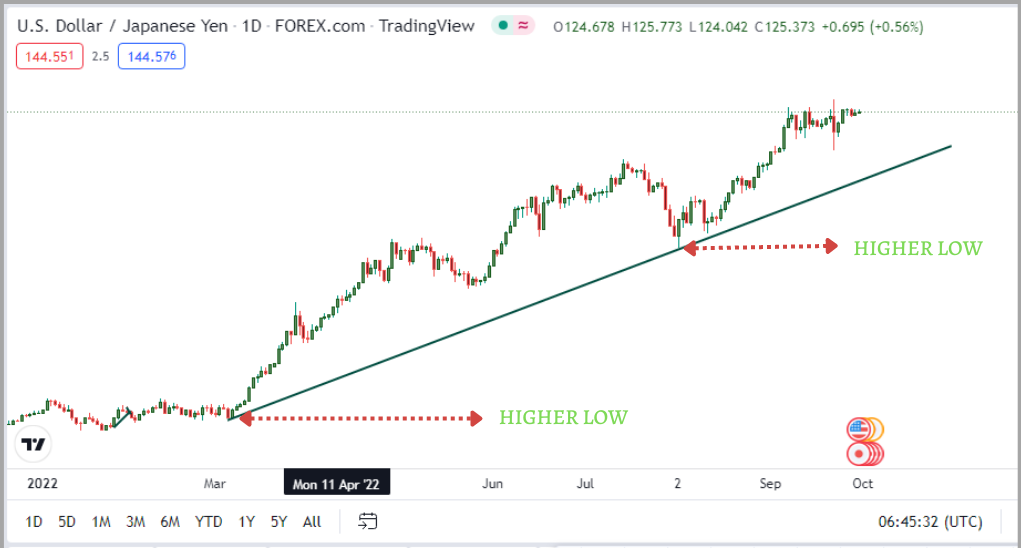
Higher lows + higher lows = “uptrend“, or
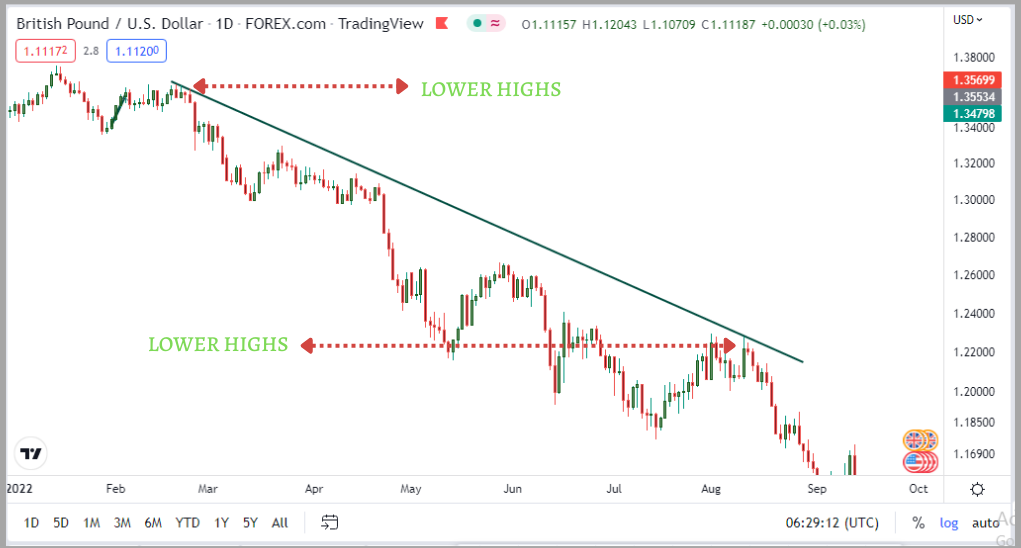
Lower highs + lower highs = “downtrend“.
Technical Analysts draw trendlines to enable them to identify observable decisive points so that when the price gets to their identified points,
They would be able to get into high-probability trades and trades with a reasonable risk-to-reward ratio.
More On Trendlines…
Trendlines are one of the most popular yet wrongly utilized tools.
Why?
Many do not know how to correctly draw trendlines and hence, wrongly use them.
Especially when using them as part of their major trading strategy.
But this article has got you covered because you would be learning how to draw them and more importantly, help you use them correctly in your trading strategy.
Roles Of Trendlines
We all see trendlines on the charts and most of us don’t usually know what they are used for
And this section says it all.
With that
I would briefly touch on two major roles in how trendlines help trend traders decide proper trading decisions on the charts.
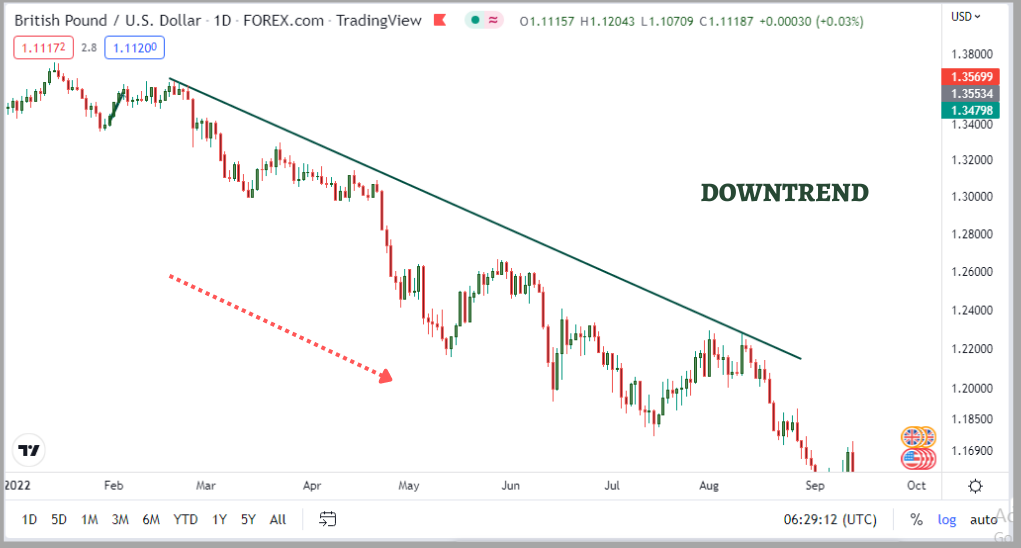
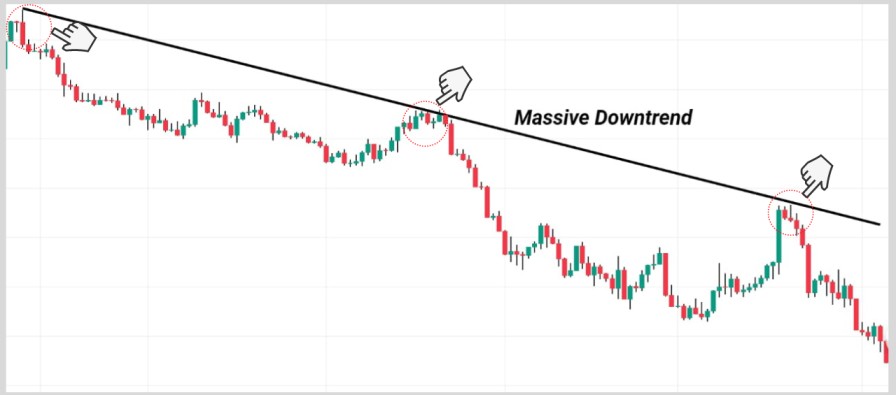
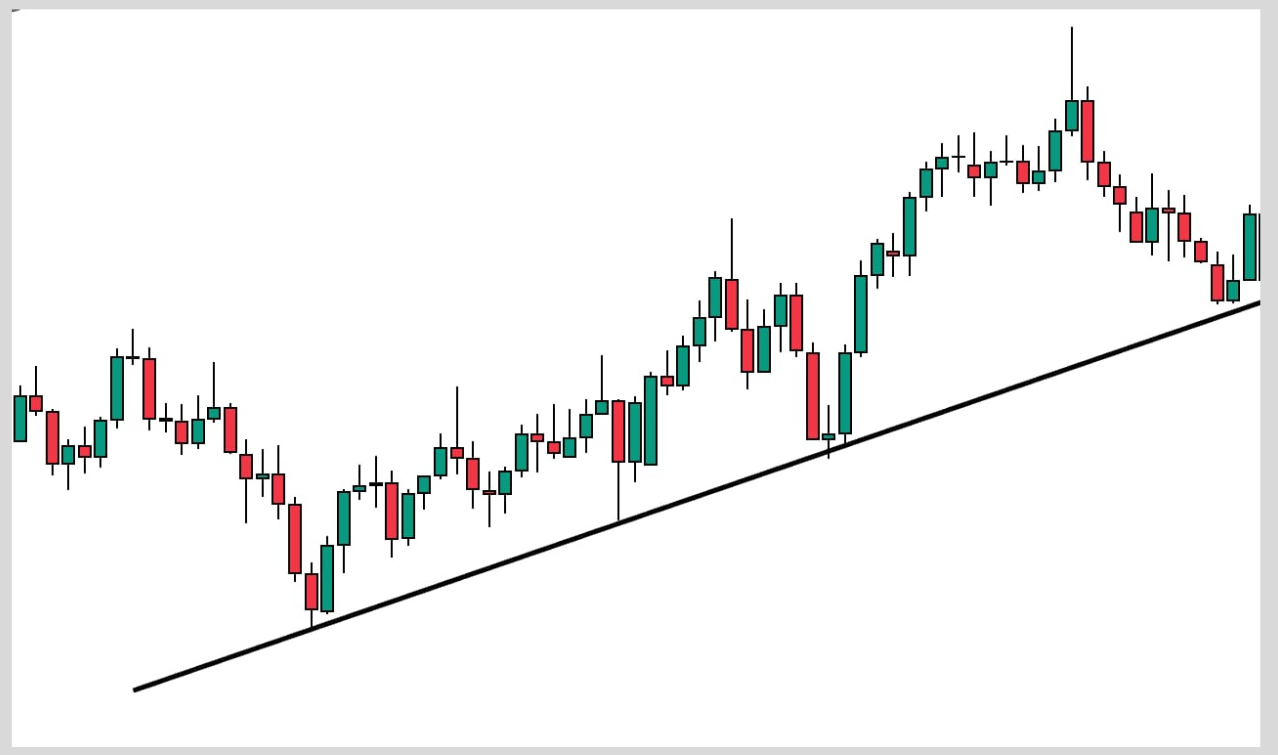
The direction of the trend:
Trendlines help traders have a very good idea of the direction in which the market would move.
They help traders to spot and verify the trend of the market.
Below is an example of a trendline, helping to identify the direction of the trend.
And a downtrend too.
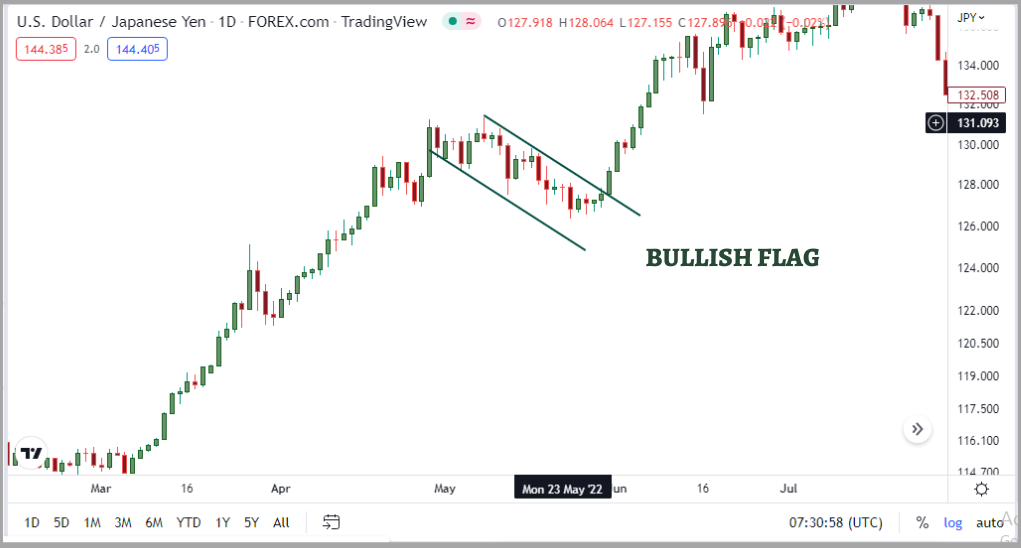
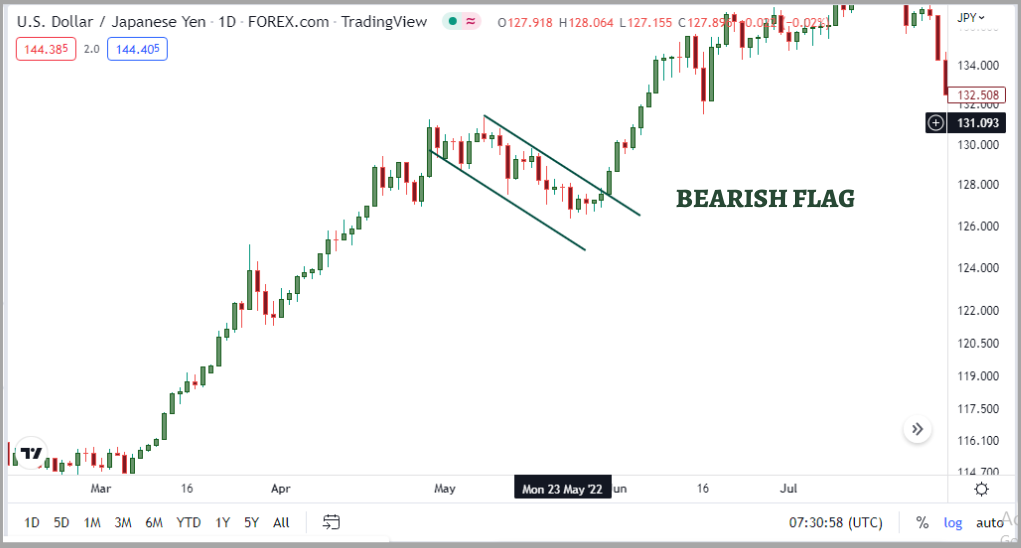
Price patterns:
Whenever a trader is drawing a chart or price pattern, trendlines help the trader to properly connect the trend so as to help them properly recognize the chart pattern formation.
Chart pattern formation like flags, wedges, and so on.
Below is an example of chart formation formed with trendlines
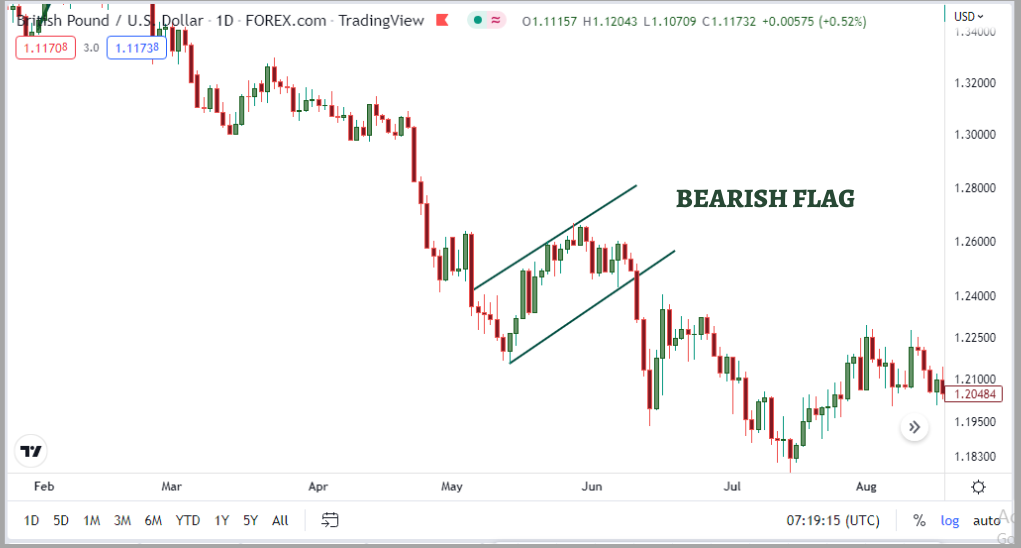
And bullish flag
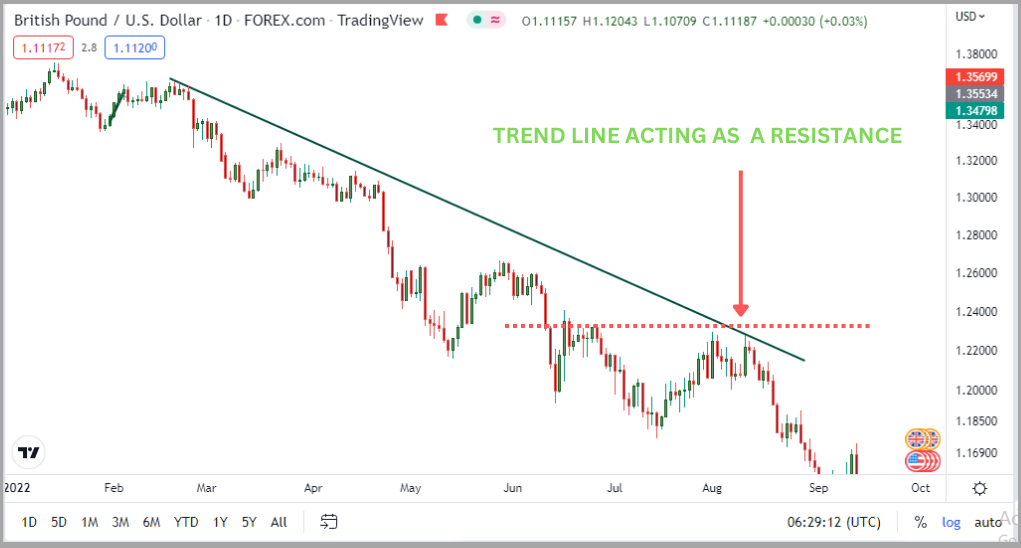
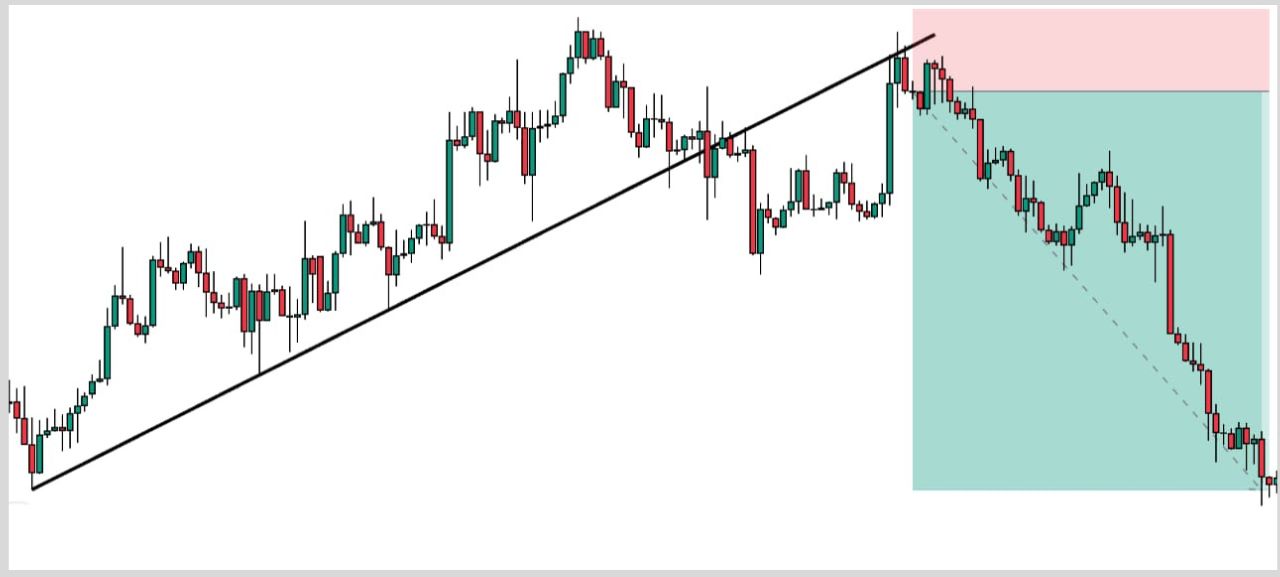
As a Potential Support or Resistance Level:
The trendline can be so good to spot a strong trend in the market, but when combine with support or resistance level, the trading decision becomes easier to execute.
The image below says it all.
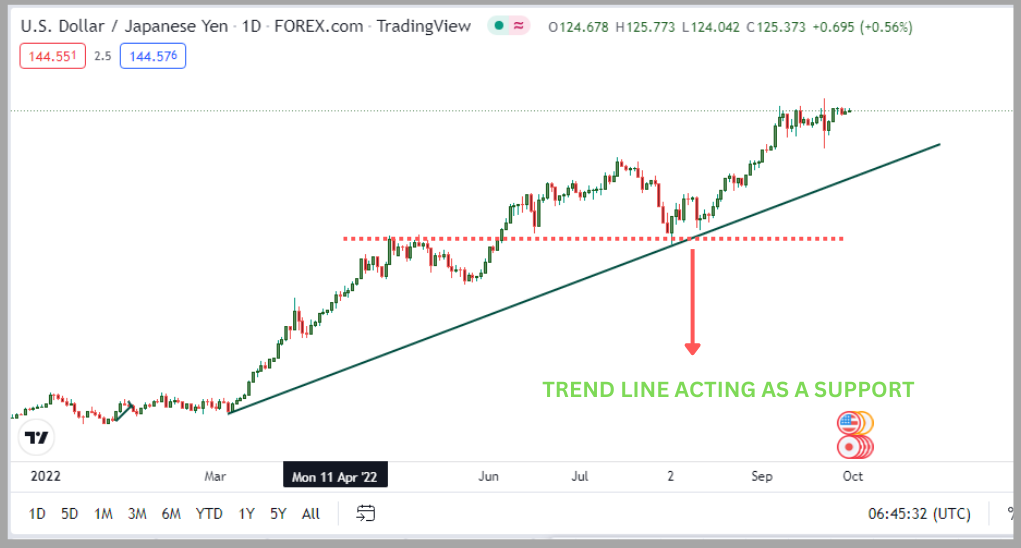
The reverse is the case in a downtrend market acting as a support.
Sniper Entry Points (Counter Trendlines):
When it comes to getting a perfect entry point in the markets, trendlines give you these edges.
Not just that,
Price makes a series of higher highs and lows (uptrend) and lower lows and highs (downtrends).
As shown, the price is downwards, making lower highs, pullbacks, and lower lows.
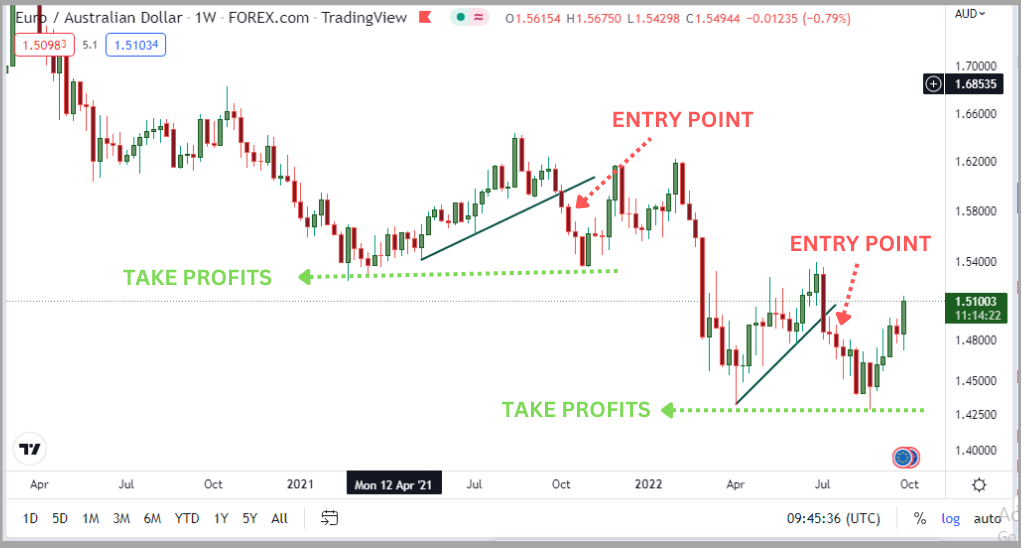
Those pullbacks in a trending market can be perfect moments to get into a trade.
And counter-trendline helps you achieve that.
Unlike normal trendlines, counter trendlines are usually small due to their application (more on that later).
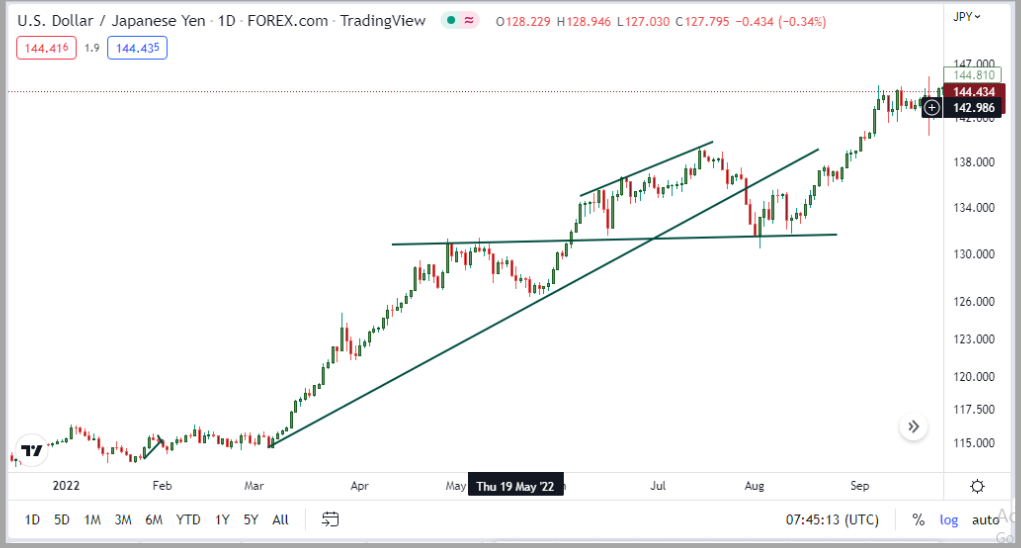
Triangular Trendlines Pattern:
Trendline formations can be in a triangular pattern in (2) ways.
The Ascending trendline.
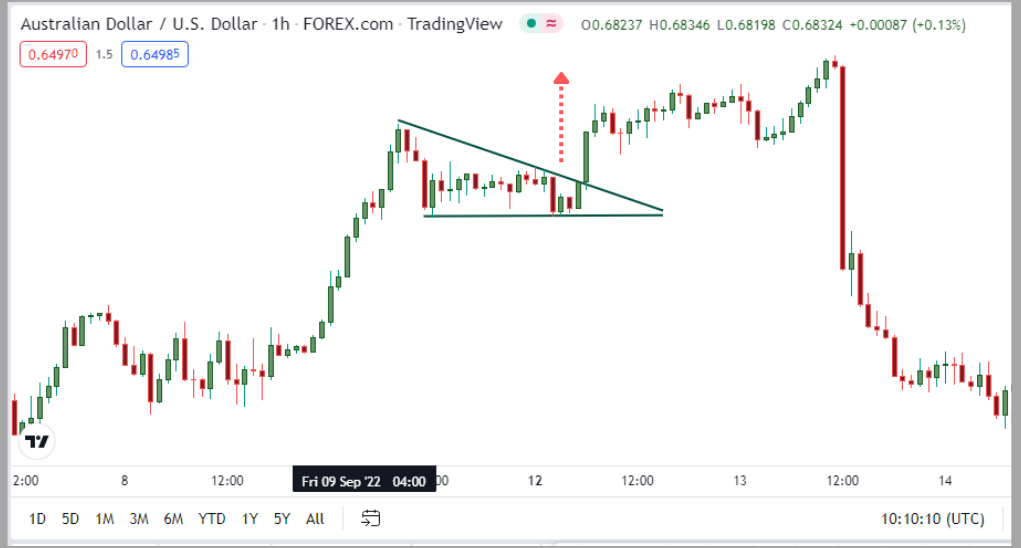
The Descending Trendline
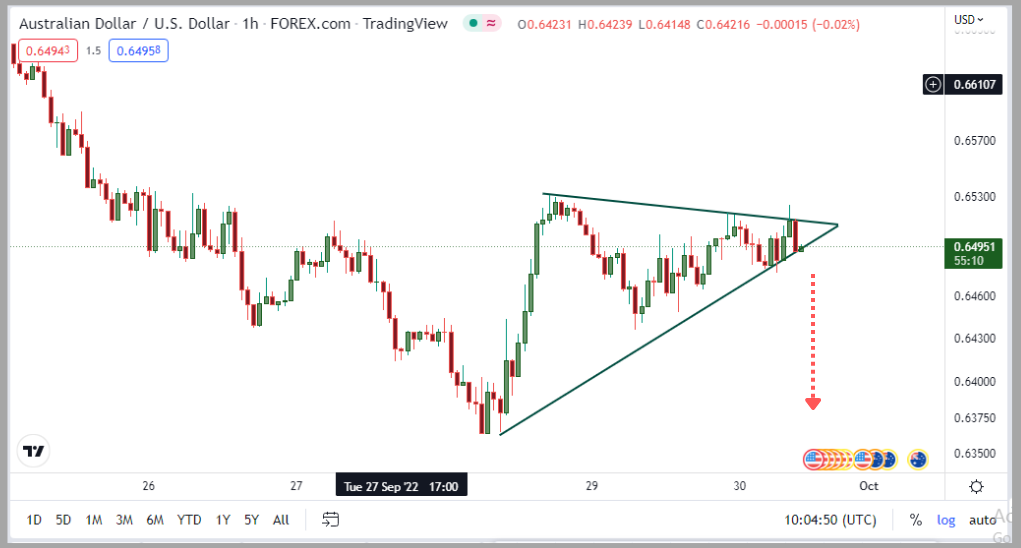
Once the price breaks below or above this pattern, there is a high chance price will continue to move in that direction for a period of time.
How To Draw Trendlines Correctly
Drawing Trendlines are relatively easy like there is nothing fancy to it.
But most traders do it the wrong way, and it causes them a lot.
A typical approach to this example is as shown.
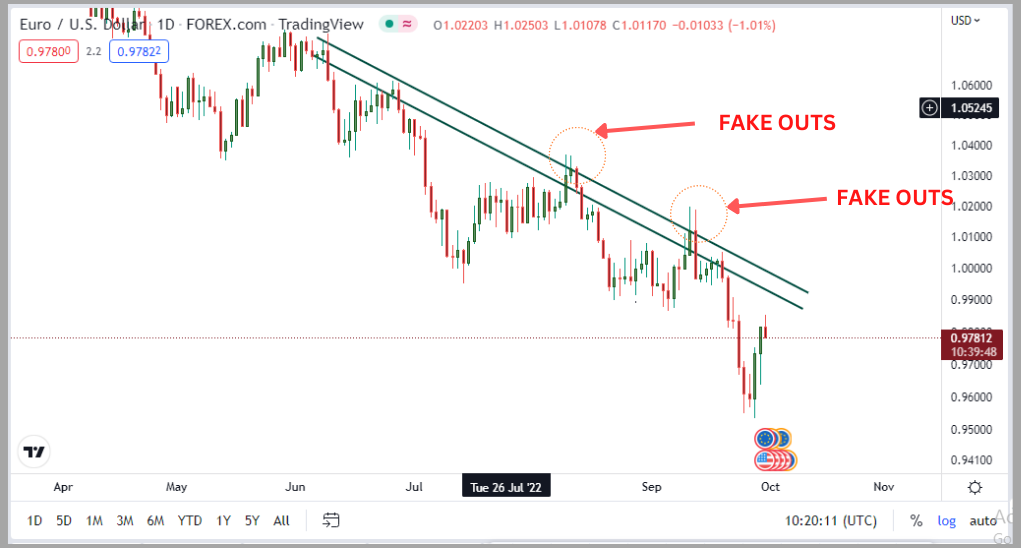
When not drawn properly, you are potentially doomed for fakeouts trading decisions.
Why others may fill it out on their charts like this, all in the name of drawing lines?
lol, nothing wrong with the second image but can cause a huge distraction and fill your charts with congested lines that may not be necessary.
With that,
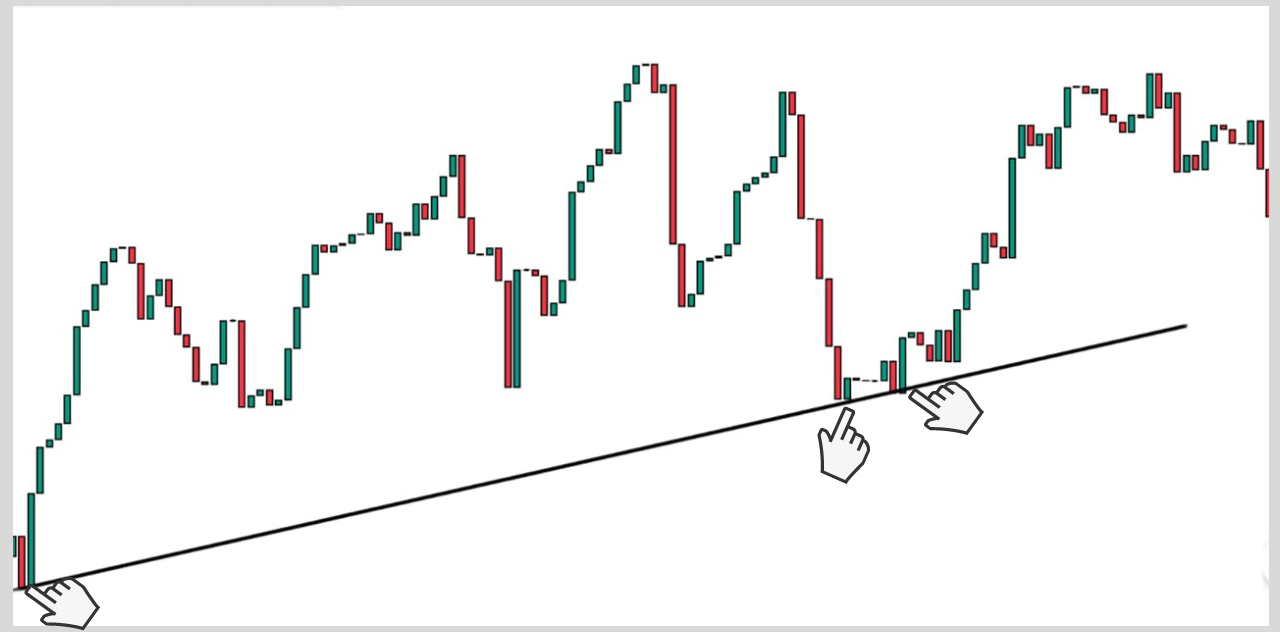
You only need to ensure trendlines are properly drawn touching at least the first 2 outermost parts of the candlesticks chart and then furthermore until the touches are no longer valid any longer.
Yes. It is as simple as ABC.
A typical example is given below using an uptrend.
Ensuring the wicks of the candlesticks are touching the trendlines, at most (2x).
From experience, it is a bad approach if you draw your lines close to the candlesticks.
Bottom Line: you are doomed to fakeouts trades as mentioned earlier.
Same for downward trendlines
And besides, not all candlesticks formations are meant to have wicks.
Does that mean you shouldn’t draw trendlines? Absolutely not.
In this scenario, what matters is “if is touching the two outermost parts of the body of the candlestick“.
If yes, then it is proper.
As you can see below.
Things To Note When Drawing Your Trendline
Now is should warn you to pay very close attention to this section,
Because I would be unveiling the common mistakes many traders make when it comes to drawing trendlines, so you can avoid them.
“Don’t Ever” try to force in the trendline if it is not meant to be there.
The mistake commonly made by many traders is that they try to force trendlines to fits into the trends.
This leads to an inappropriate approach to drawing a proper trendline.
An example of this approach is this.
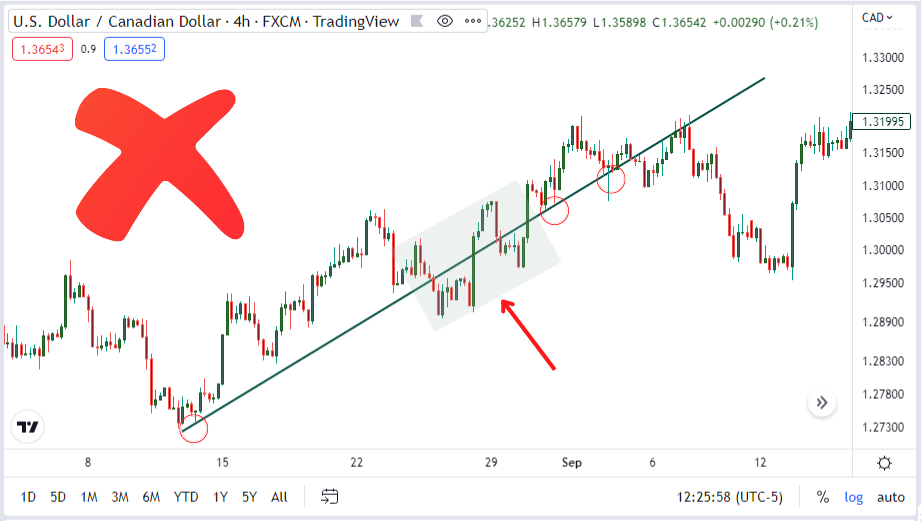
By doing this, they no longer follow the rules of drawing a trendline, and then the market works against them.
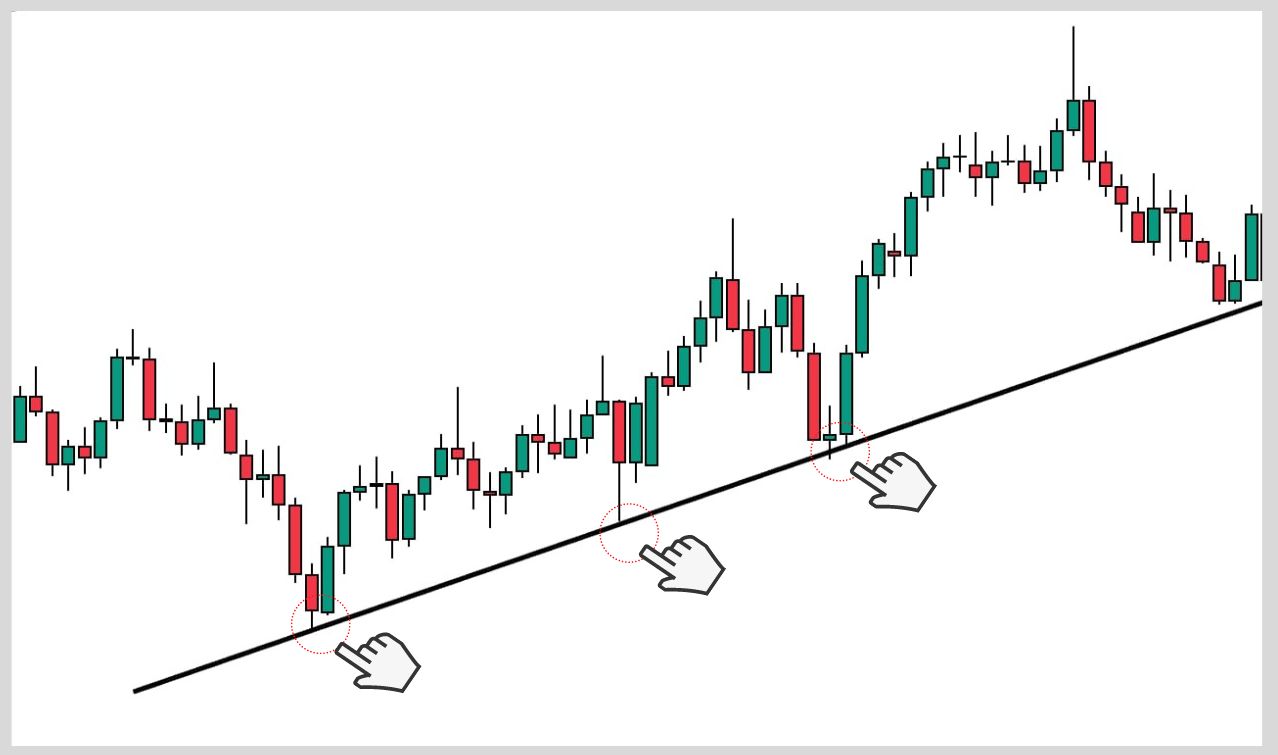
Another thing for you to understand is that for a trendline to be considered violated or broken,
There must have been at least two full-body candles close below or above the trendline as the case may be.
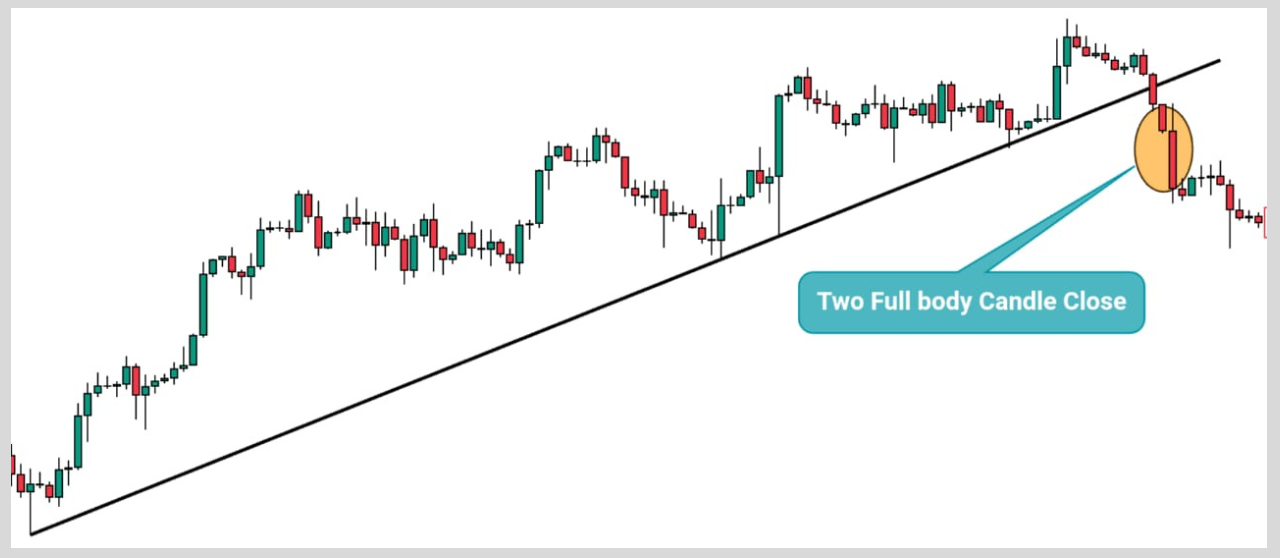
In many cases,
Wicks does break candles but this does not mean that there has been a break of trendline or it has been violated.
As a matter of fact, the market manipulators usually allow a candle to close above or below, so as to create a false break of the trendline which is not true.
Hence,
The reason I advise this is that there must have been a very solid and energetic break of the trendlines before thinking the trendline has been broken.
With over 11 years of trading experience,
I have come to realize that the third bounce off the trendline, is usually the juiciest of them all.
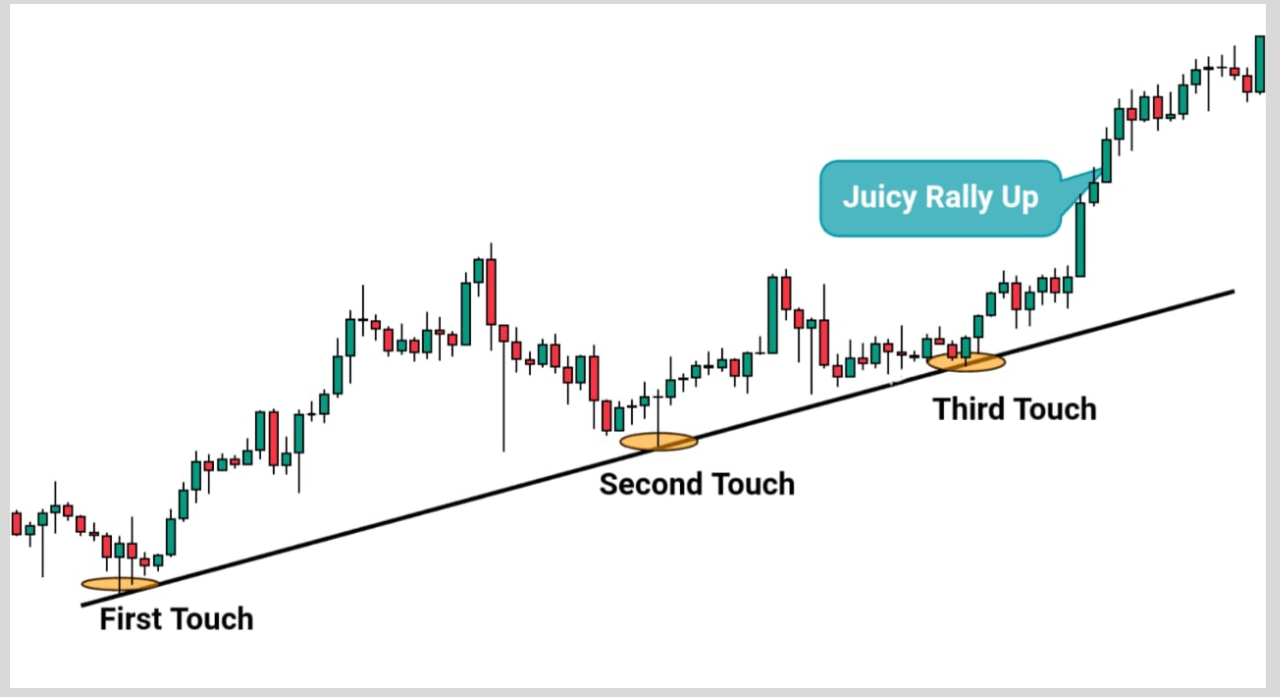
As you can see, the third bounce usually does this trick, it really rallies up toward the direction of the original trend.
Now go check it out yourself on your tradingview charts.
On that note.
you might want to pay very close attention to every third bounce off the trendline and in direction of the trend.
The more steep your trendline is, the less reliable it would be.
Research has proven the fact that trendlines drawn between 30° and 45° are usually the most reliable.
You do not need to put a protractor on your screen to get the correct angle.
Just a fairly steep trendline will do.
So, you might need to watch out for how steep or how horizontal it would be.
Having known how to perfectly draw trendlines,
it is only good that we consider the types of trendlines that there are.
This leads us to
Types Of Trendlines
In this section,
we would uncover the types of trendlines in the world of trading, as necessary in forex trading.
But before we continue, I have a little question for you.
What do you think gives birth to the types of trendlines?
You must have gotten the gist right?
Yes! Trend.
The type of trend of the market determines the type of trendline at that time.
Keeping that in mind, there are two major types of trendlines.
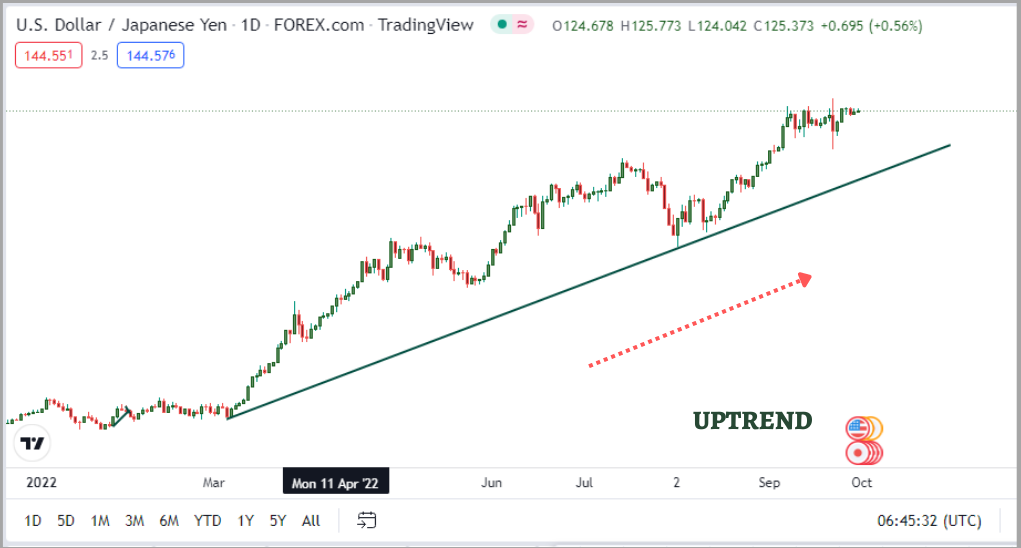
Ascending or Uptrend lines:
As you know, price forms higher highs and higher lows when moving in an uptrend.
Therefore,
Trendlines drawn to connect higher highs or higher lows together are called an Ascending Trendline or Uptrend line.
You have seen it before.
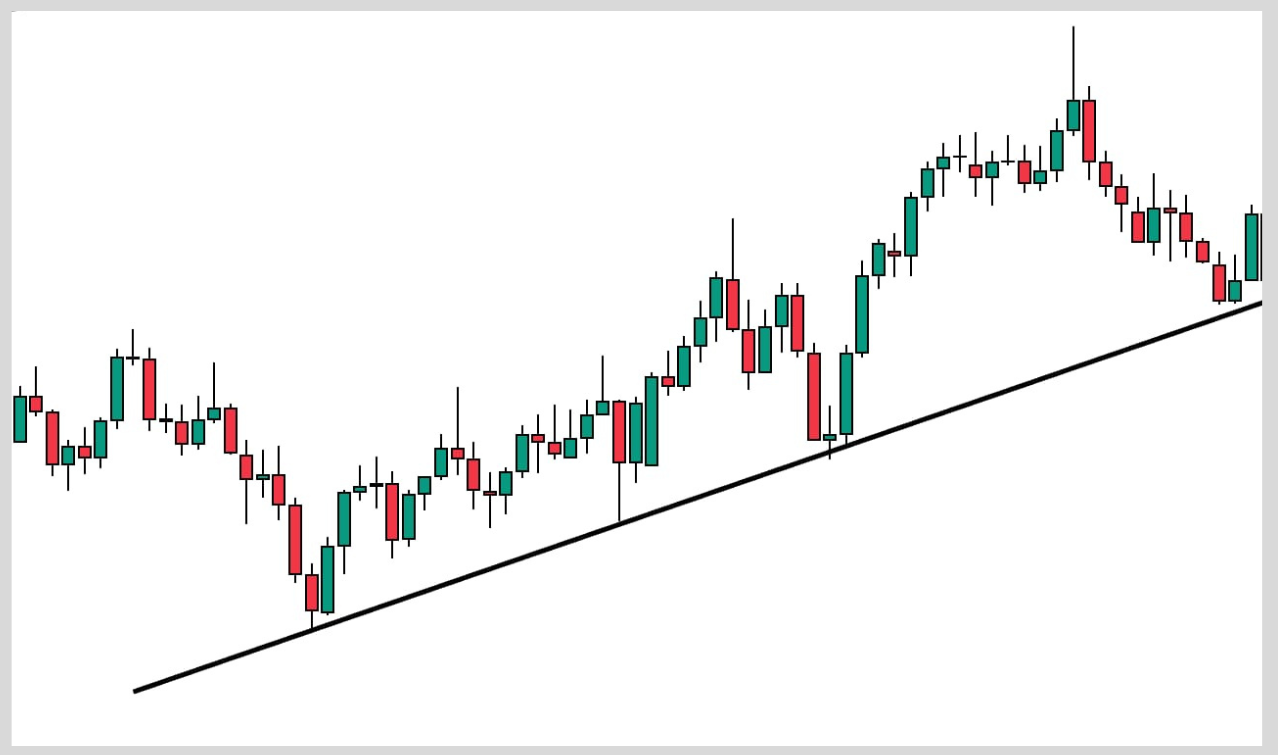
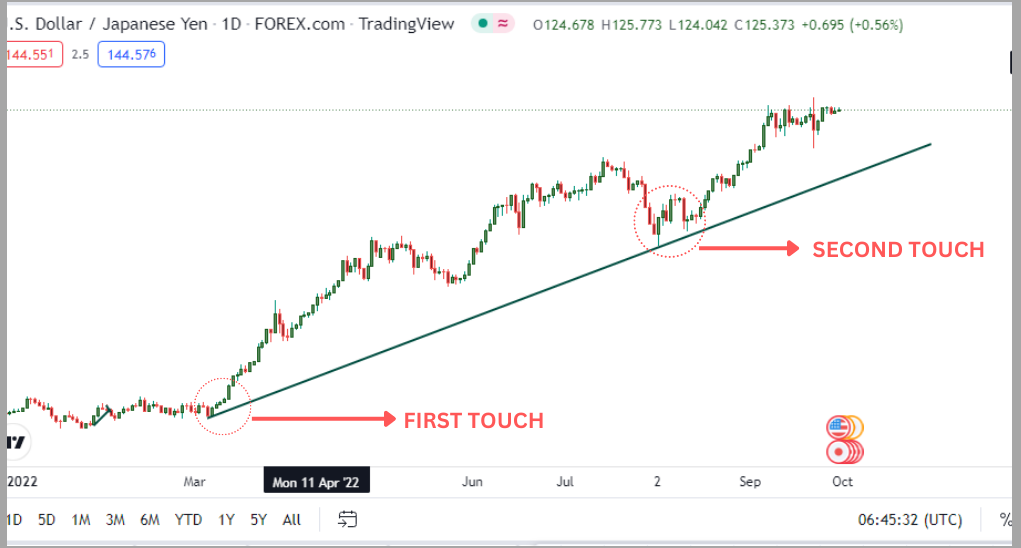
How To Draw Ascending (Uptrend) Trendline:
Identify swing lows in trending markets (uptrend).
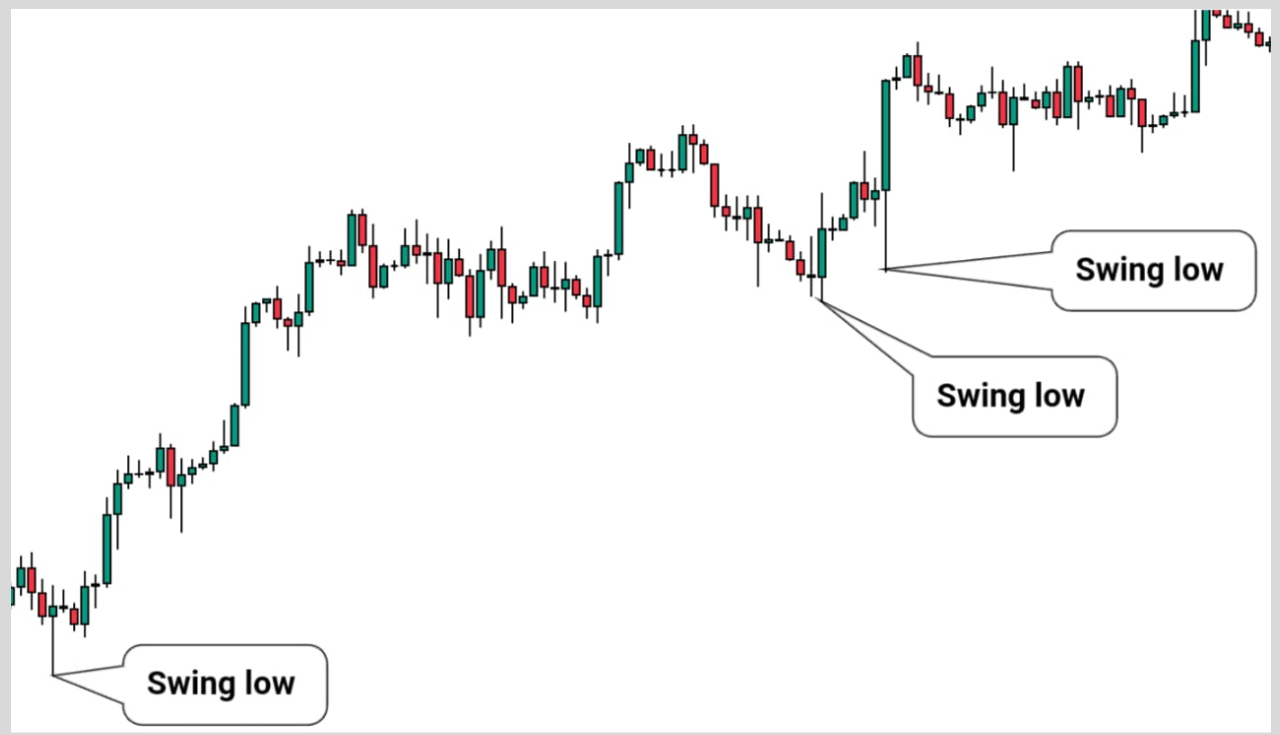
Focus on 2 swing points in the downtrend region.
Connects the two swing points together and also ensures the trendlines are touching the wicks of the candles.
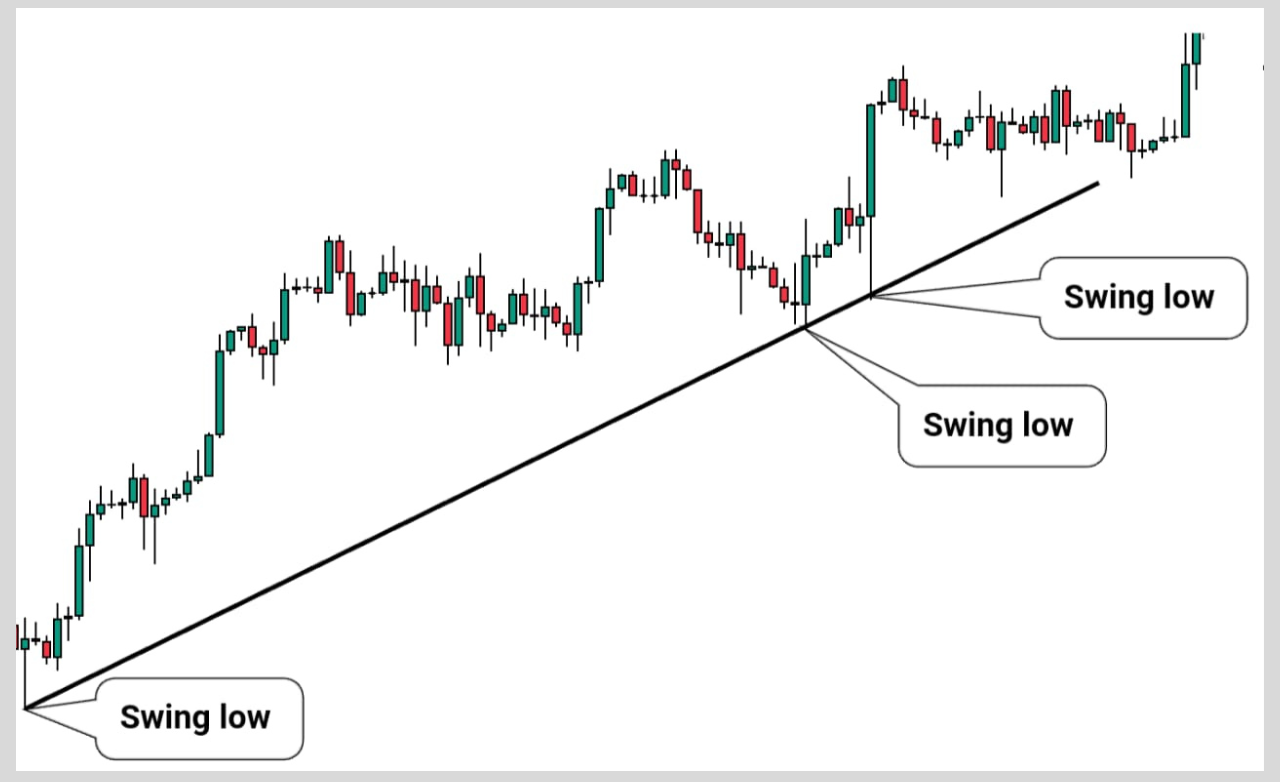
If no wicks pointing out then it is fine, draw them touching the bottom parts of the candlesticks like this.
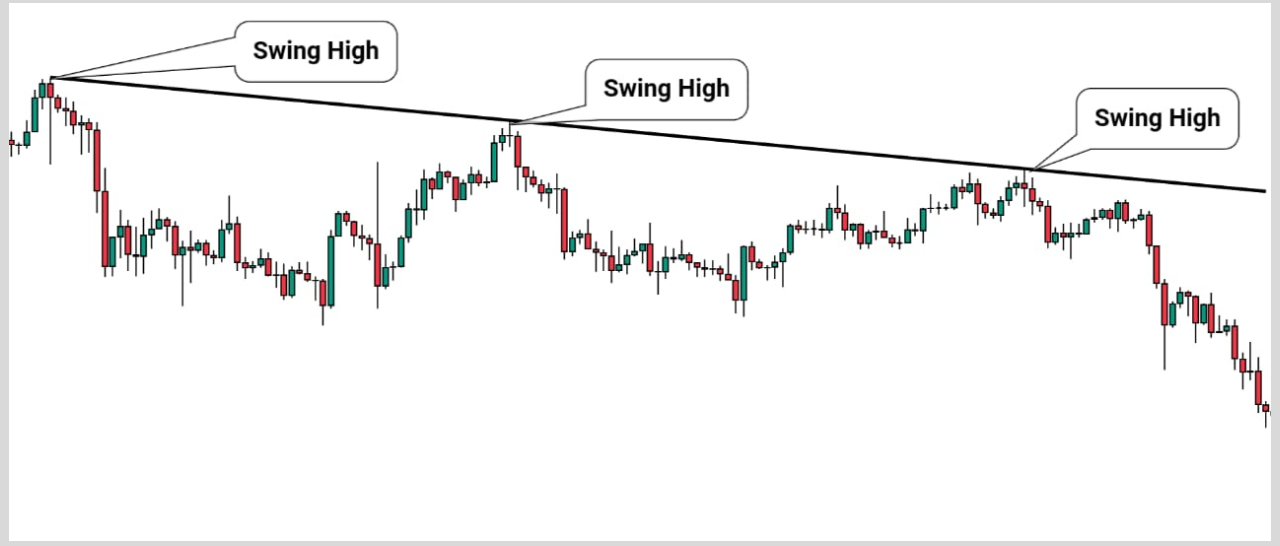
Descending or Downtrend trendlines:
Also,
when a financial instrument forms lower highs and lower lows, you know that we are in a downtrend.
This means that any line that is drawn to connect lower highs or lower lows together is called a Descending Trendline or a down trendline.
Below is a typical example.
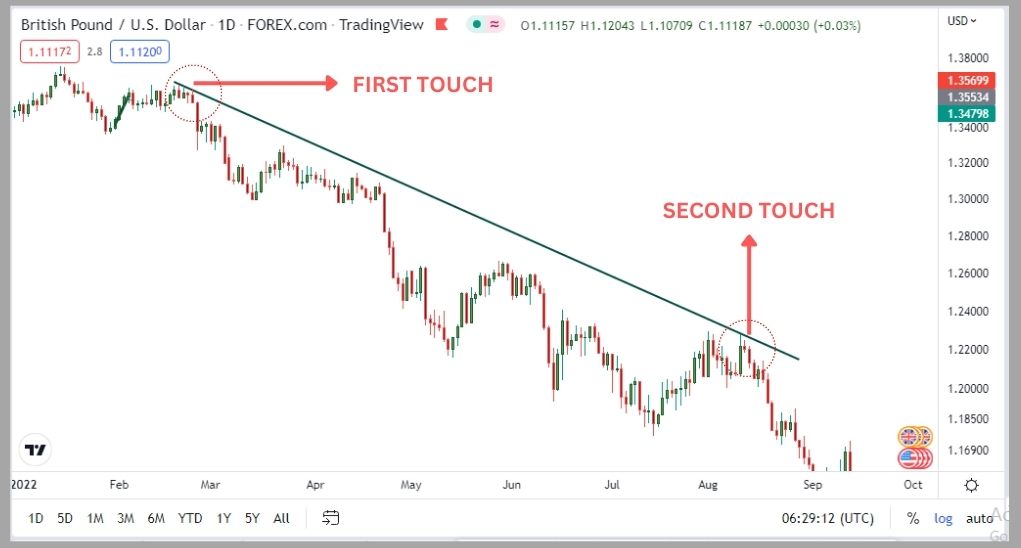
How To Draw A Descending (downtrend) Trendline:
Identify swing lows in trending markets (downtrends).
Focus on 2 swing points in the downtrend region.
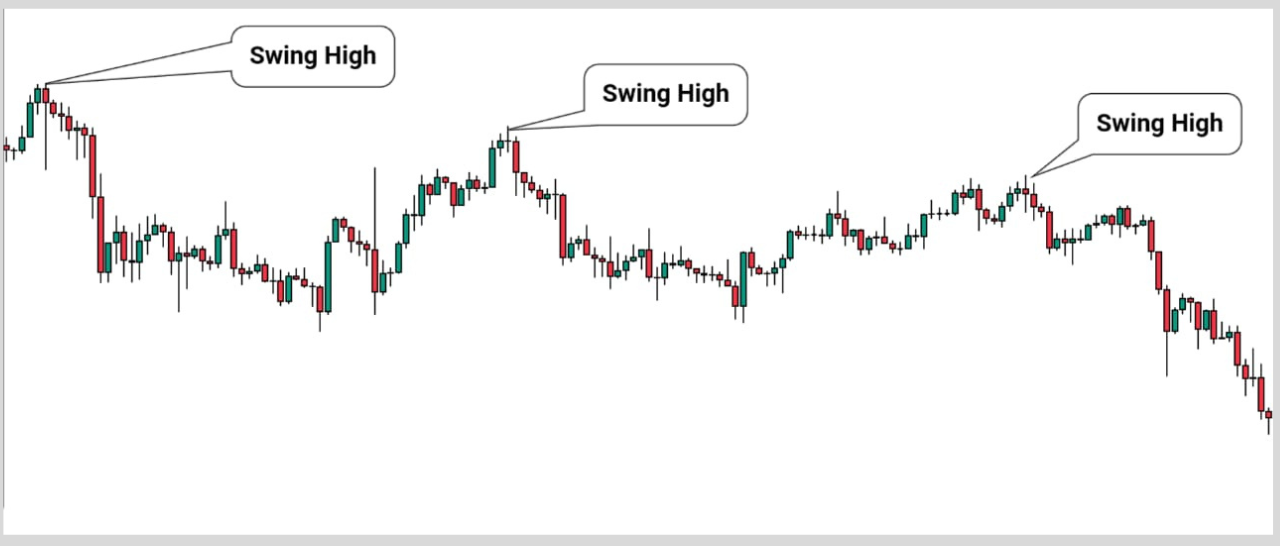
Connects the two swing points together and also ensures the trendlines are touching the wicks of the candles.
If no wicks pointing out then it is fine, draw them touching the bottom parts of the candlesticks
Another type of “trend” is the, ranging market scale the “Range“.
Range:
In a range-bound market, prices do not move up or down. Price moves within a particular range.
An example is shown below.
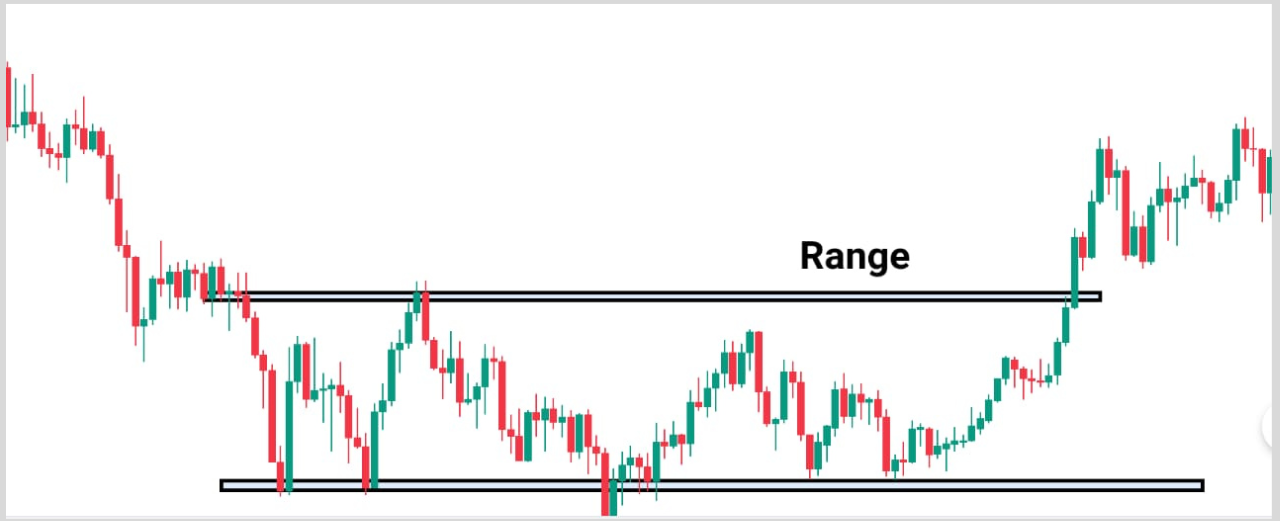
Usually, a range-bound market could be very frustrating for traders.
But the break of a range is usually a very juicy setup for many, as long as you understand how to use it.
Another little tip for you.
When two trendlines are drawn parallel to each other, it is called a Trend Channel.
A Trend channel is drawn by connecting the highs and lows of a financial instrument together.
Below is an example.
Moving on, let’s now consider.
How To Use Trendline To Your Advantage.
Firstly, you have to plot your trendlines accurately as I have established earlier.
Secondly, you can develop a strategy with the use of trendlines that would help you extract money from the market.
Here is a simple trendline strategy that I would like to share with you.
It is called the Break and Re-test of the Trendline.
Below are the rules guiding this strategy.
- Identify an already existing trend and draw your trendlines, perfectly connecting the points together.
- Wait for the break of that trendline. Also, wait for the re-test of that trendline.
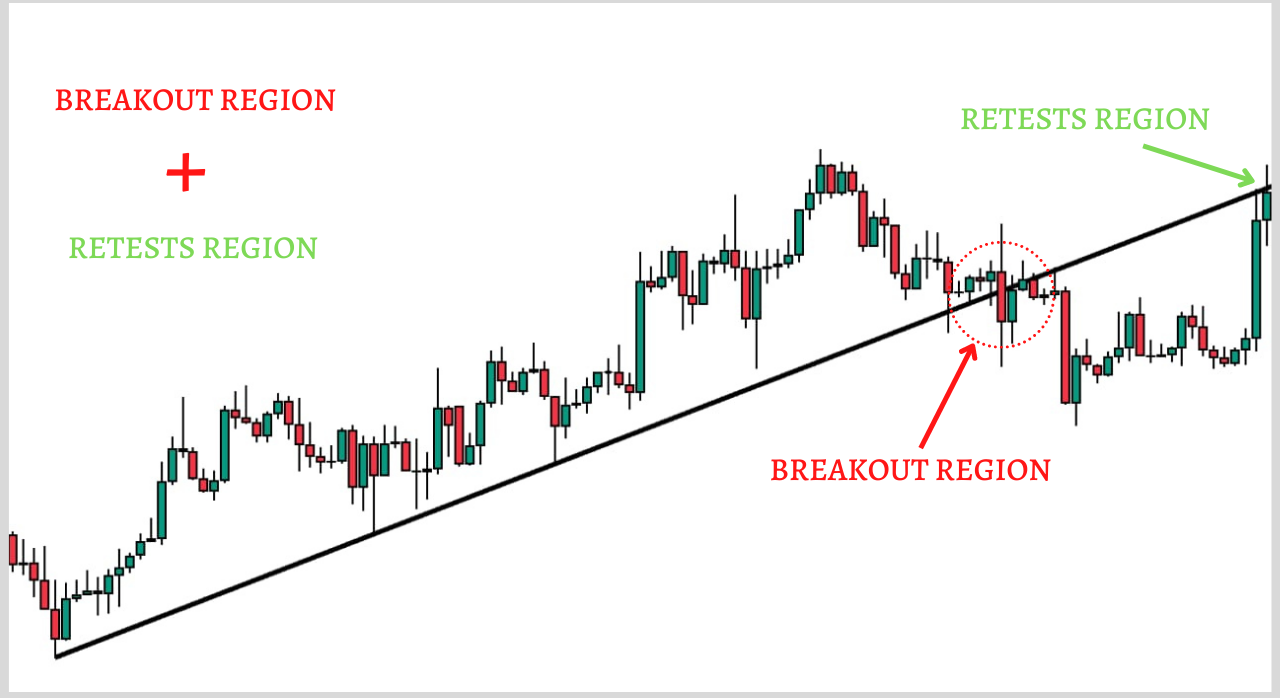
- At the retest, wait for a reversal candlestick pattern to form e.g. the engulfing or rejection candles.
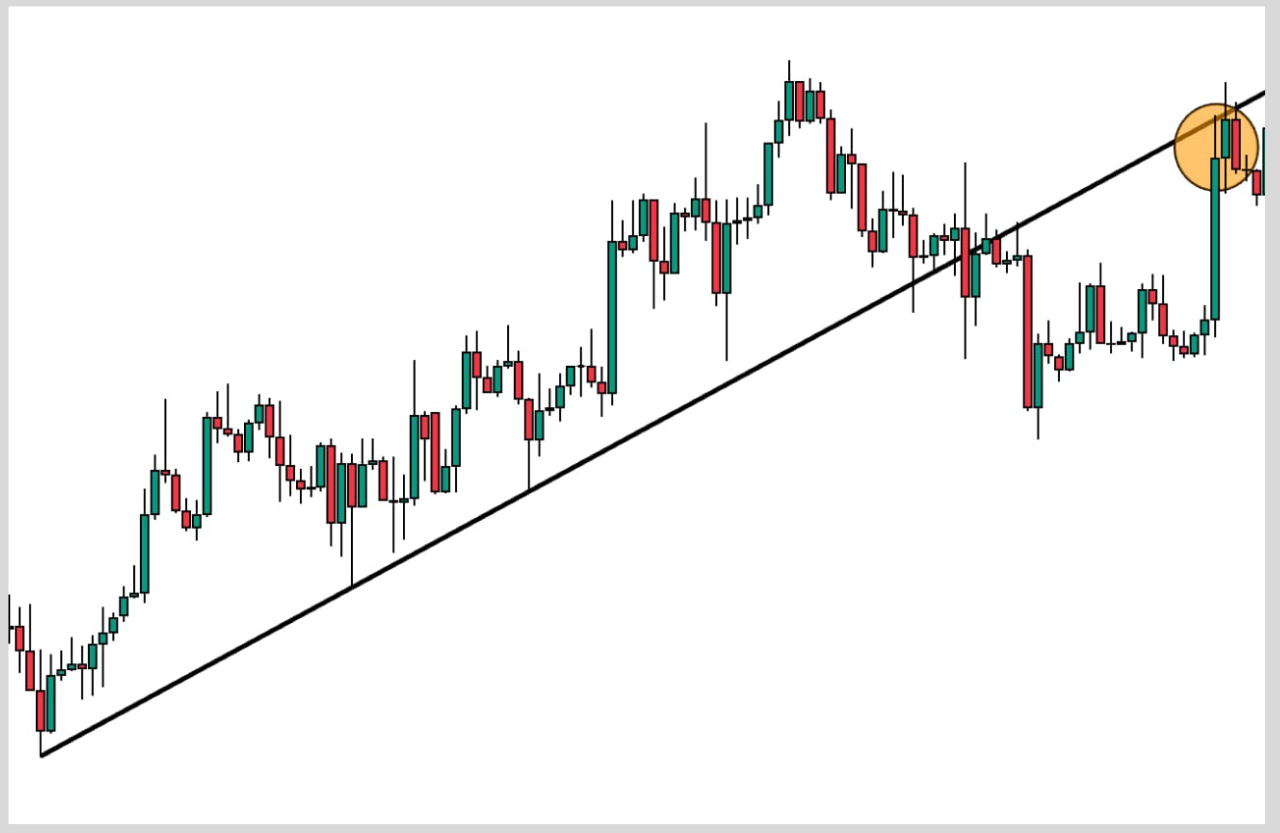
- Then at the opening of the next candle, place your trade and set your stop-loss above the previous high or below the previous low as the case may be.
- To set your profit target, you can deploy the use of the Fibonacci Retracement tool or select the next high or low as your profit target.
Conclusion
In this article, you have learned
- The definition of Trendlines,
- How to perfectly draw your trendline,
- Things to watch out for when constructing your trendline,
- This is a simple strategy you can use when trading with a trendline.
Now it is Your Turn
Which tips did you learn from today’s post?
Or
Did you just discover how to use trendlines to get entries in trading
Either way, I would love to hear from you below.