Tradingview is used by over 550 million traders, which makes it the most popular tools trader used for analysis.
It is super a powerful tool that traders use to plot their analysis and get insights into price movements.
So this article will be walking you through how to set up your Tradingview account the right way.
I will teach you how to set up your chart like this,
To this
And how to use the built-in technical tools to set up your charts like this.
Another very interesting thing to know is that you don’t need a paid subscription.
All that am going to cover here can be done using the free plan.
So, without further ado let’s get right into this.
How To Open Trading View Account.
You need to open an account with Tradingview so you can have access to their amazing features and also,
Help enhance your analysis.
In this section, I will walk you through the step-by-step action plan on how to set up your account on Tradingview.
Step 1: Sign Up On Tradingview
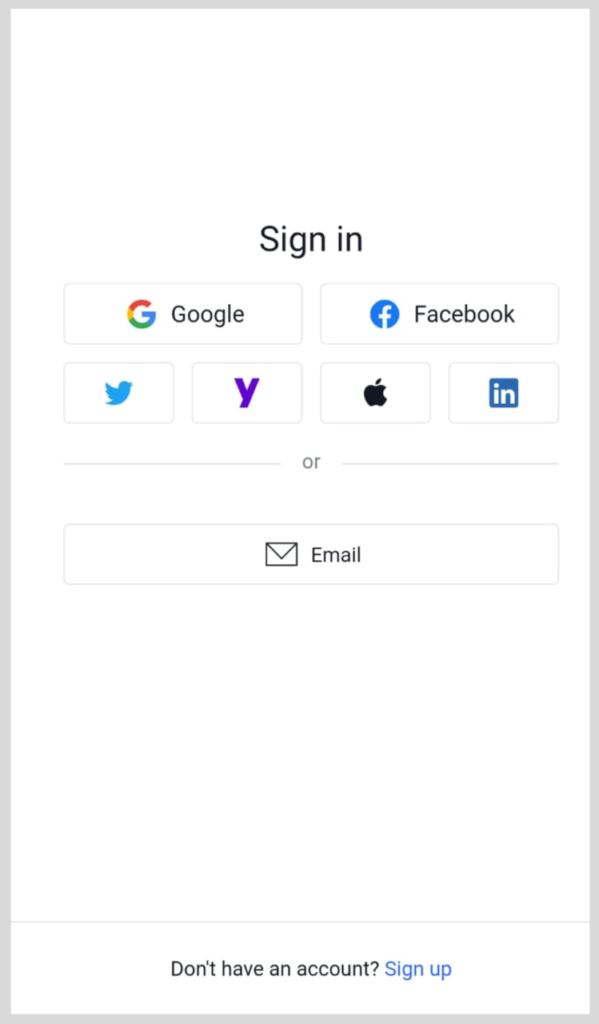
Head over to the Tradingview sign-up page.
or simply download their software application from App Store for iPhone devices or Google Play Store for Android.
But for this article, our step-by-step approach will be based on PC mode, which can be done on any browser.
Step 2: Provide Your Details
You are provided with various means for you to open an account with them.
All you need do is to use one that would be the best suitable for you.
Step 3: Confirm Your Registration
If you use your Gmail, you would be required to confirm your Gmail.
You then click on the confirmation link that would be sent to your Gmail.
How To Set Up A Clean Trading Charts
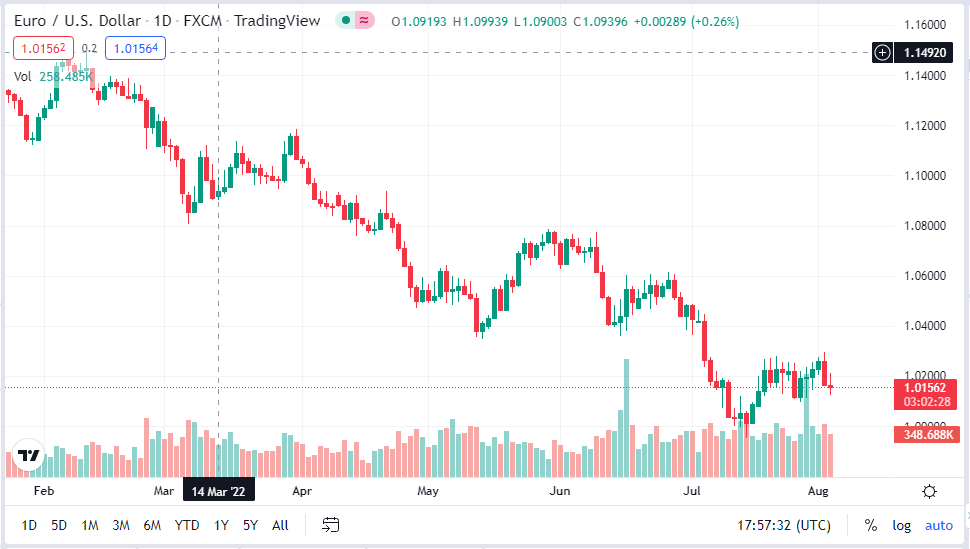
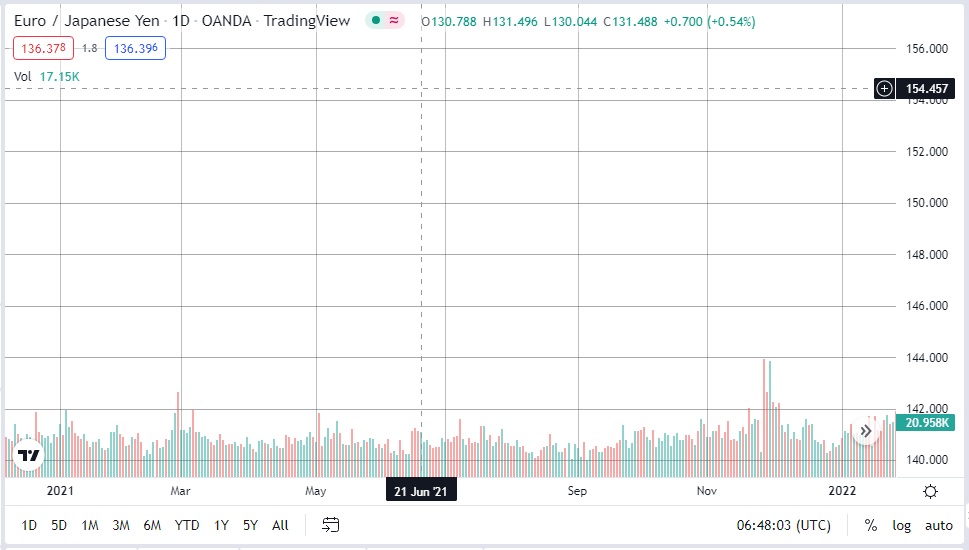
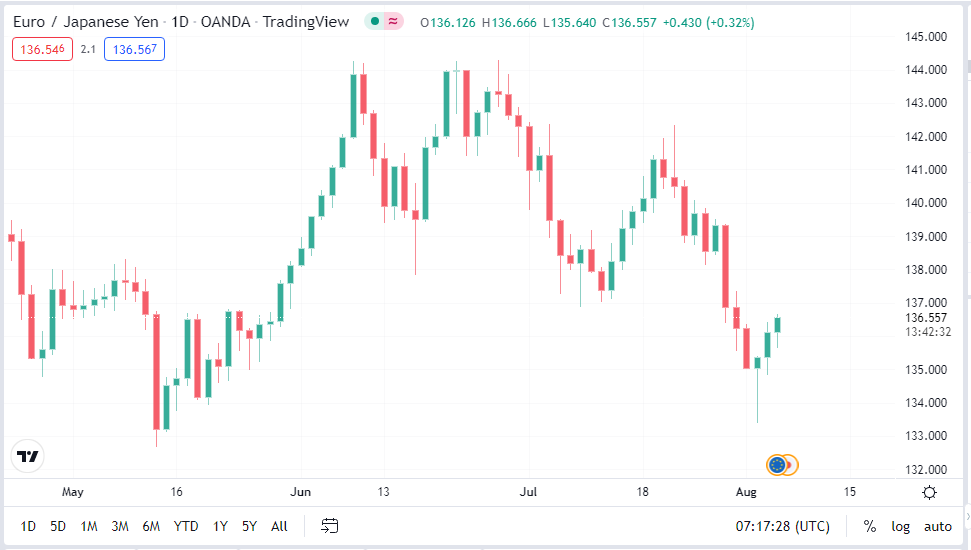
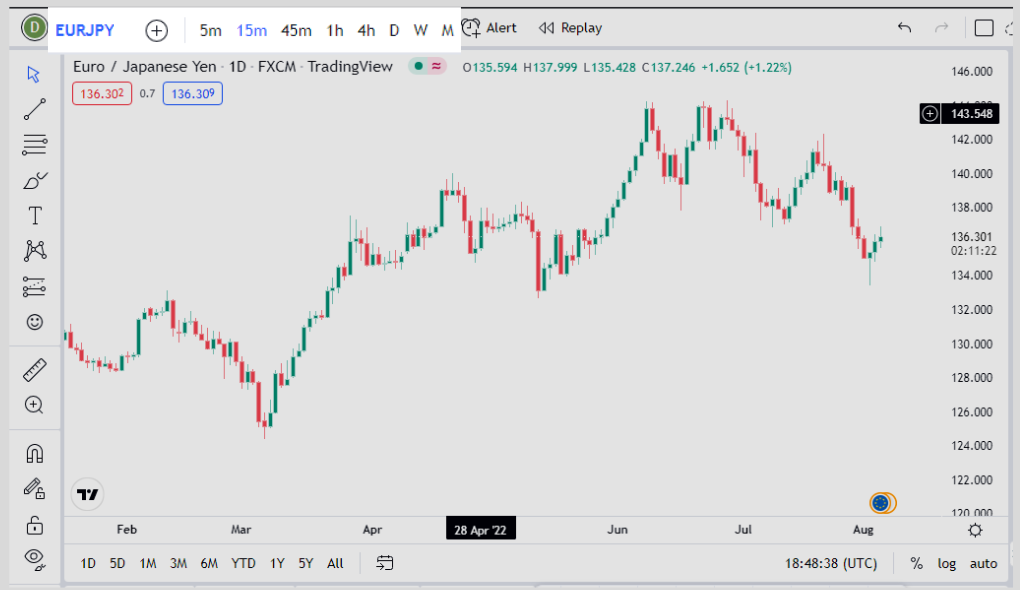
After going through all those processes of opening an account, a typical trading view chart looks like this by default.
As shown earlier.
Now, there is nothing wrong with these settings and the charts displayed.
But we just want something cleaner and less congested with useless indicators that can cause distraction.
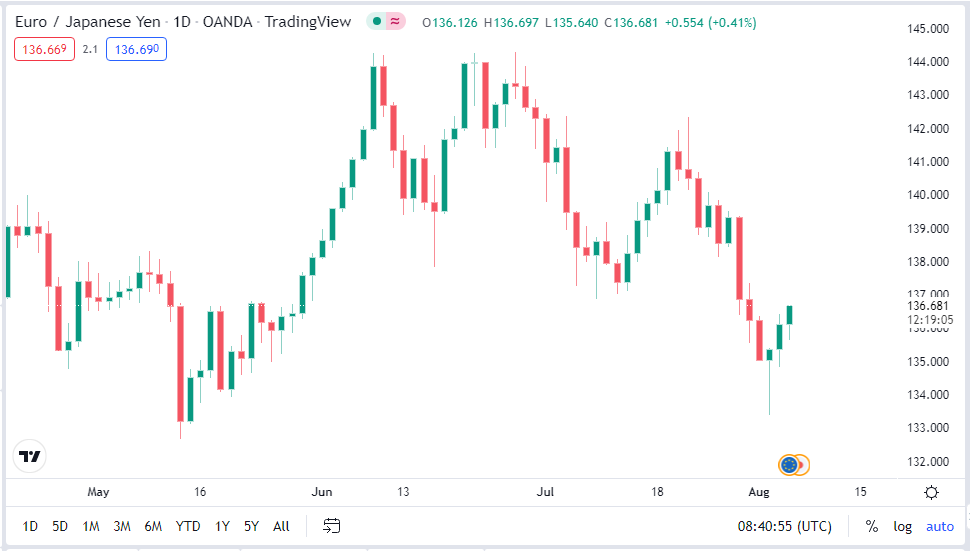
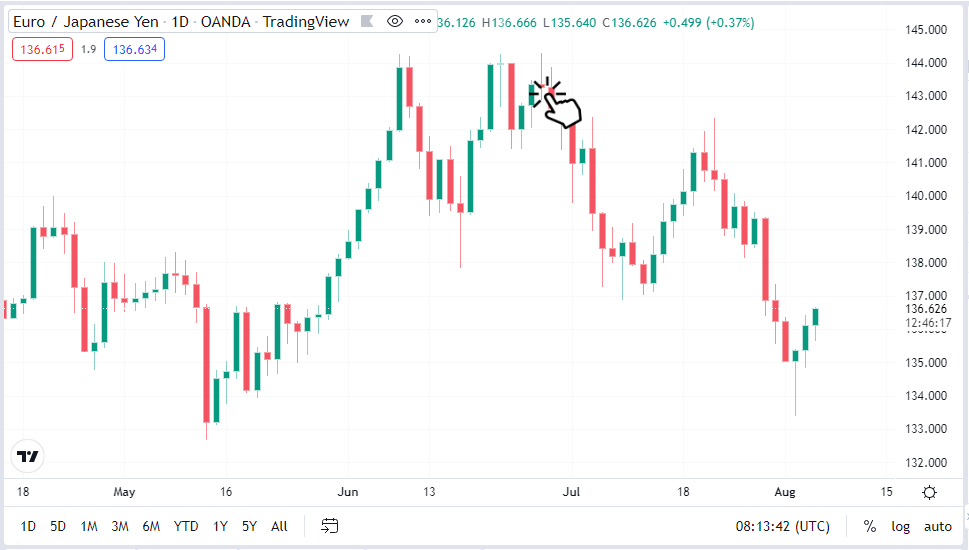
So we remove the gridlines….
Volume indicator
And change the candlestick color, now you have this.
Though the candlestick color should be based on how you want yours to be, as I will be using the default for the sake of this post..
So how can we achieve this?
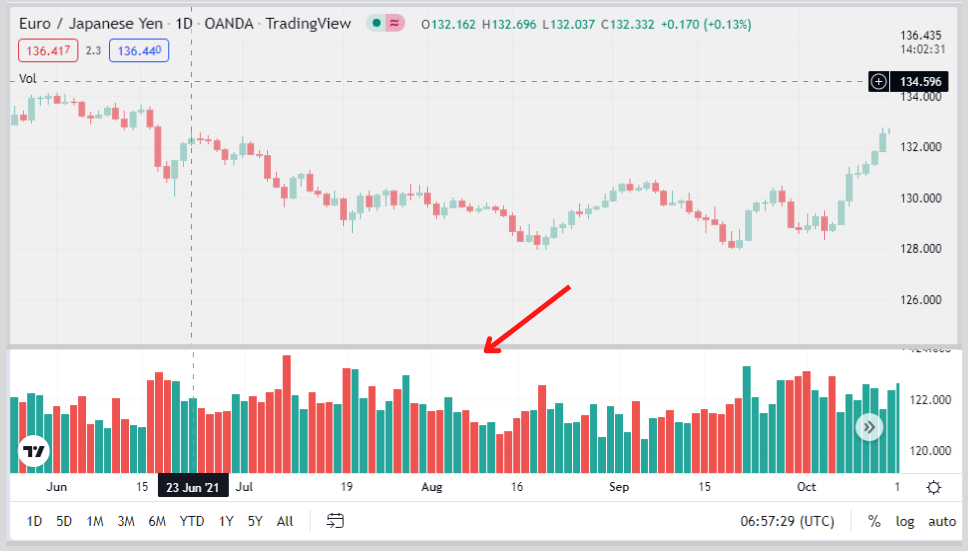
Step 1: Removing volume indicators.
Removing the volume indicator.
All you need to do is right-click on the Indicator down below.
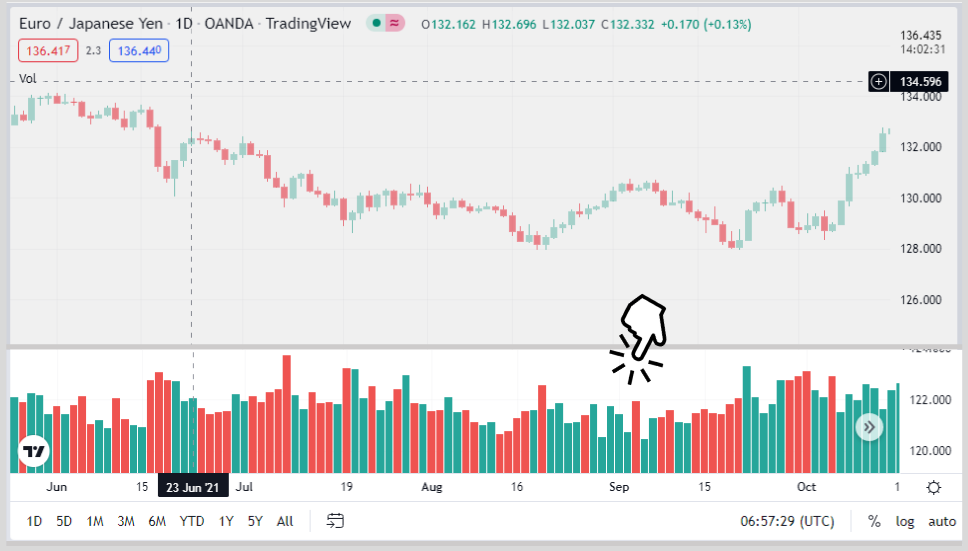
And remove.
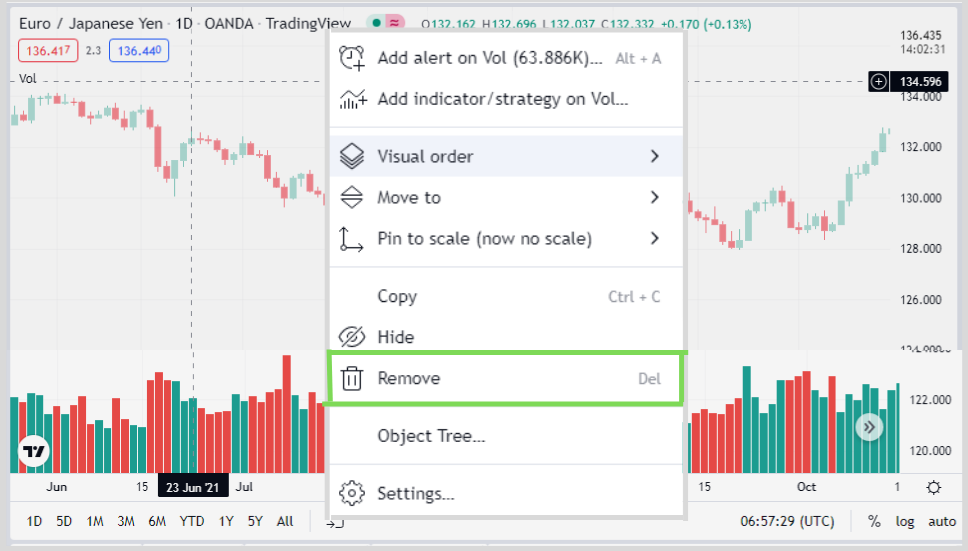
And it would be gone.
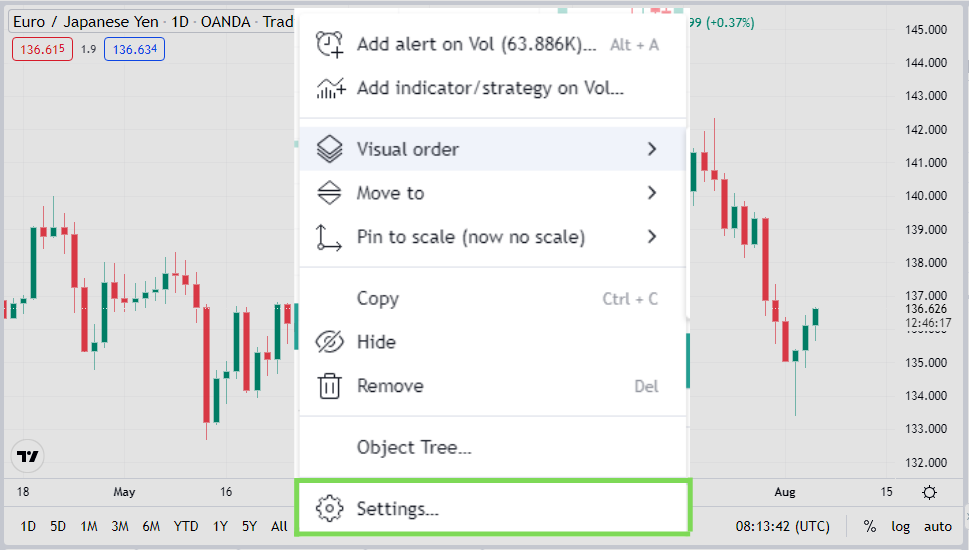
Step 2: Removing gridlines.
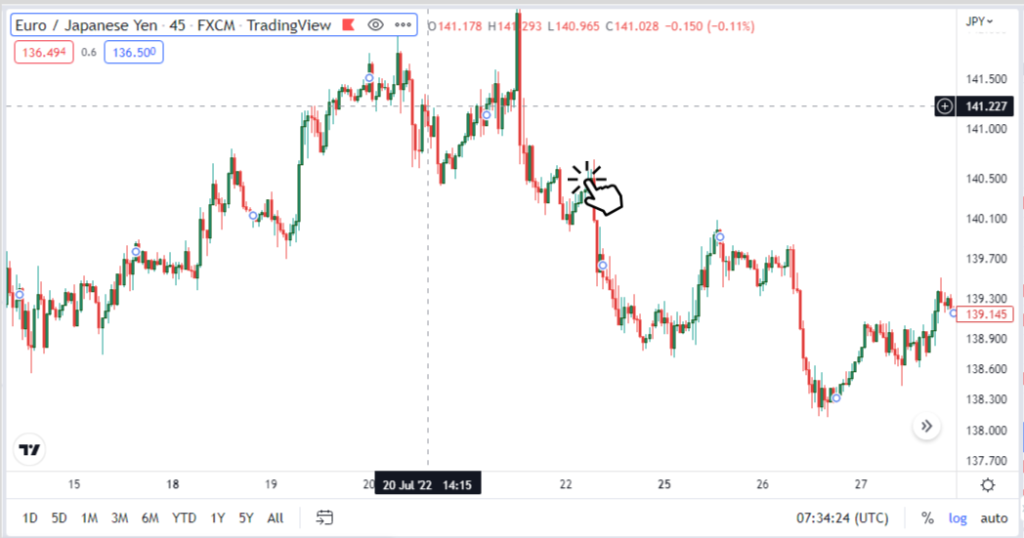
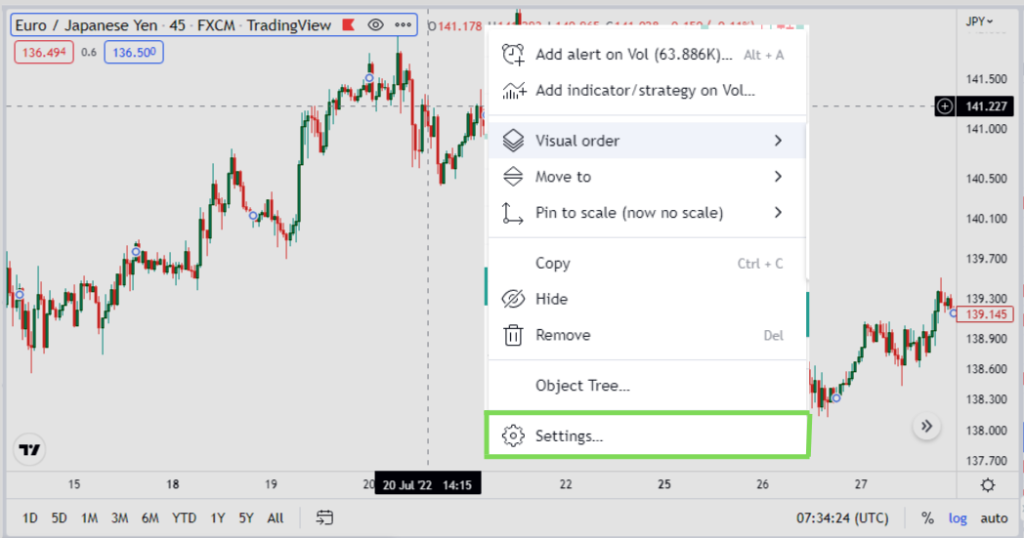
Right-click on the chart screen.
Click on settings.
Click on appearances
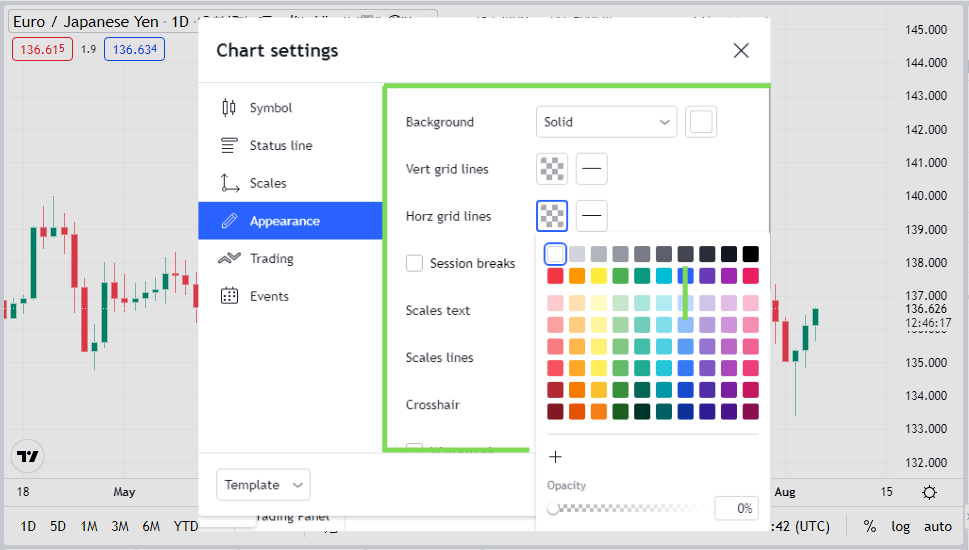
The next thing to do is,
Change vertical and horizontal lines to white.
Since the chart background that comes with TradingView is white, your horizontal and vertical lines will blend with the background color.
Therefore, eliminating the effect of the vertical and horizontal color.
Your chart now becomes like this.
Note: If you change the color of your chart background and also want to eliminate the effect of the “grid lines”, ensure that the color of your grid lines blends with the background color.
Step 3: Change Your Candlestick’s color
Actually, you can leave your candlestick colors like so.
But, if you wish to change its color, Rightclick with the cursor on the chart screen
Click on Chart Settings
Click on Symbols
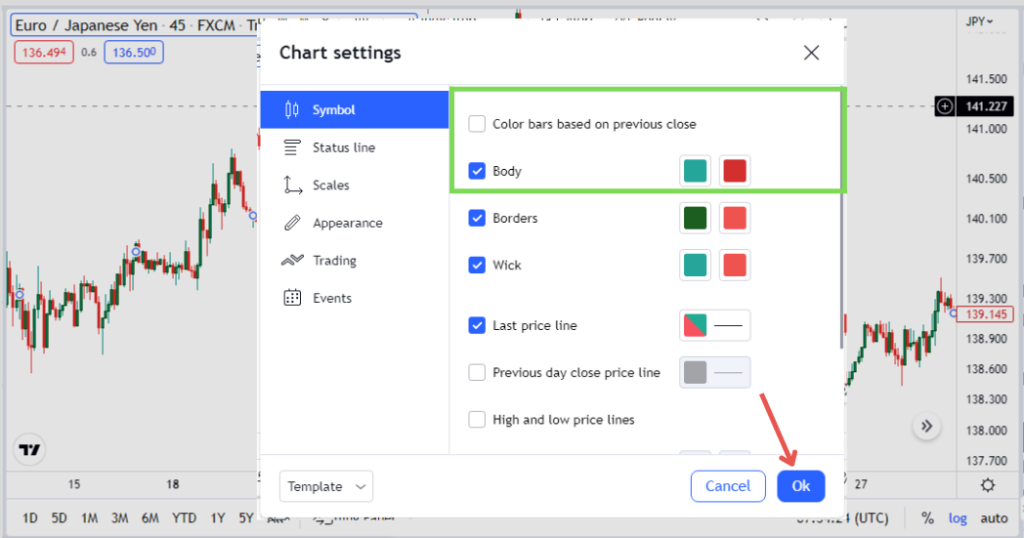
You then have access to change all you want to change!
Cool right? obviously!
Let’s move on.
How To Select Your Preferred Technical Tools on Tradingview
Now we have our charts looking good, but that is just one piece of the puzzle.
The most important part is how to choose our preferred technical tools on TradingView.
So we can easily analyze our charts and take proper trading decisions.
As for me, am not a big fan of indicators nor do I leverage them.
But for the sake of those who use any of the following,
- Moving average indicators
- Relative strength index (RSI) indicators, etc.
Here is how to find them and add them to your list.
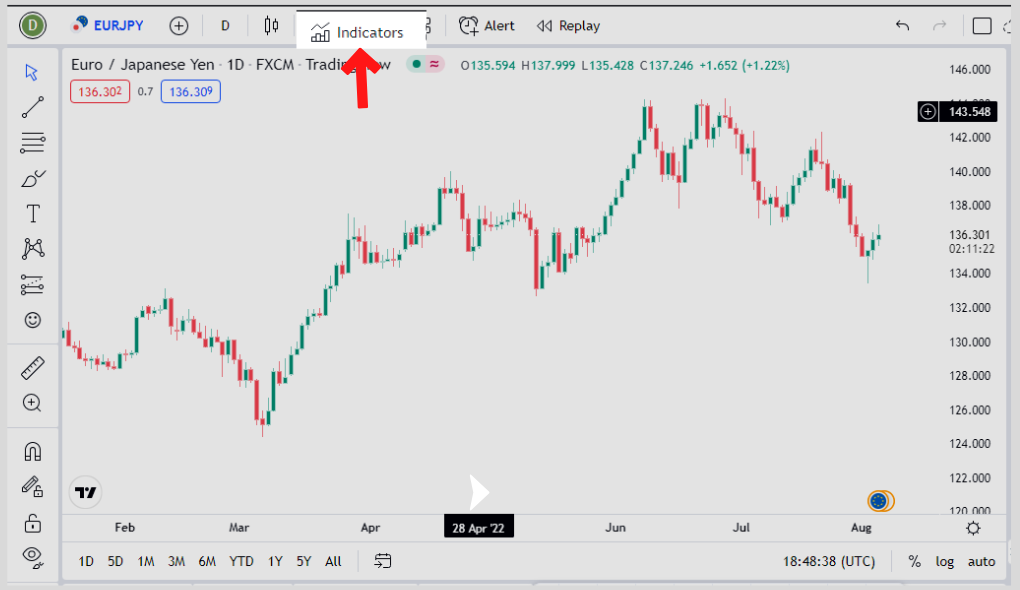
And choose your most important parts or any types of indicators you are leveraging.
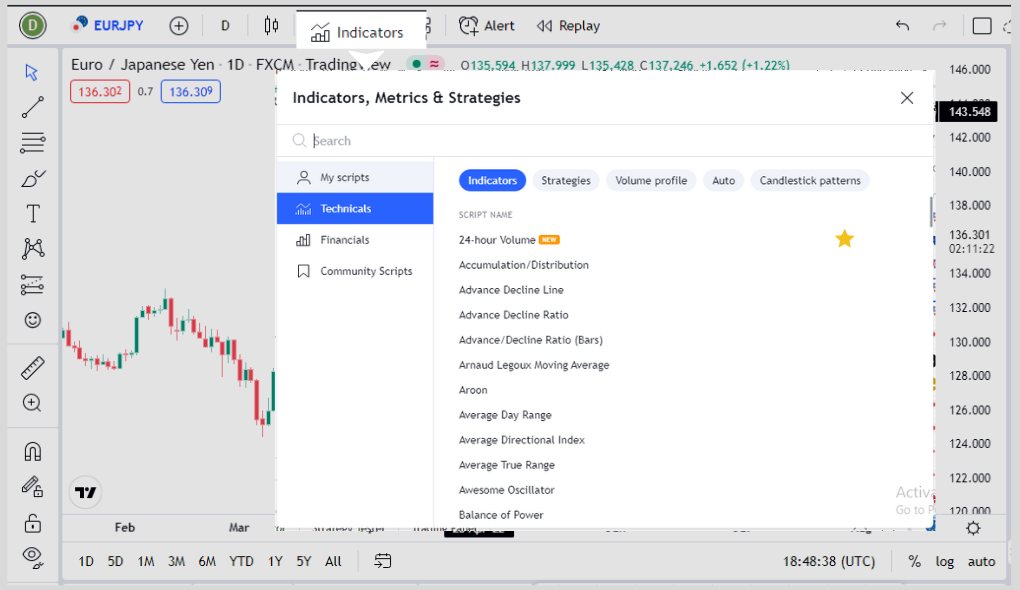
And add them to favorites by clicking or using the search bar to find them as shown above.
But meanwhile, my favorite technical indicators are
Horizontal ray for mostly potential support & resistance level
Arrow as an indication
Rectangular block as my major support and Resistance (transparent blue)
Rotated rectangular block for my minor support and resistance level (yellow).
Texts for better simplicity and written illustrations
Long and short position calculator for my entry and existing points
Fibonacci retracements for confirmation of price movements.
Ok then, there you have it.
Now see how we can locate these tools, customize them to our tastes and also use them in trade.
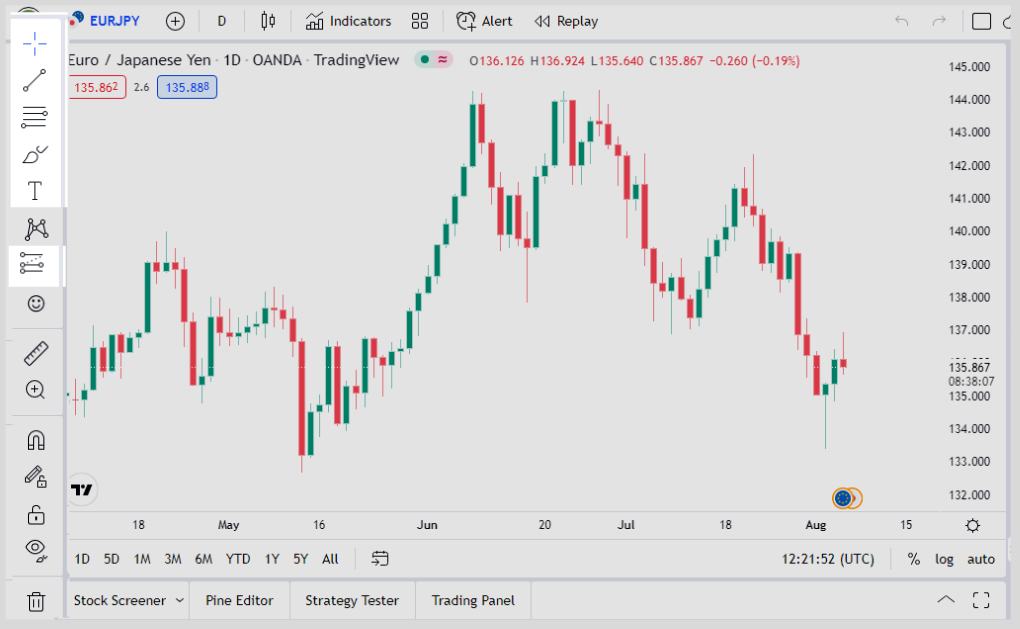
That said. Look down at your screen, and click on drawings.
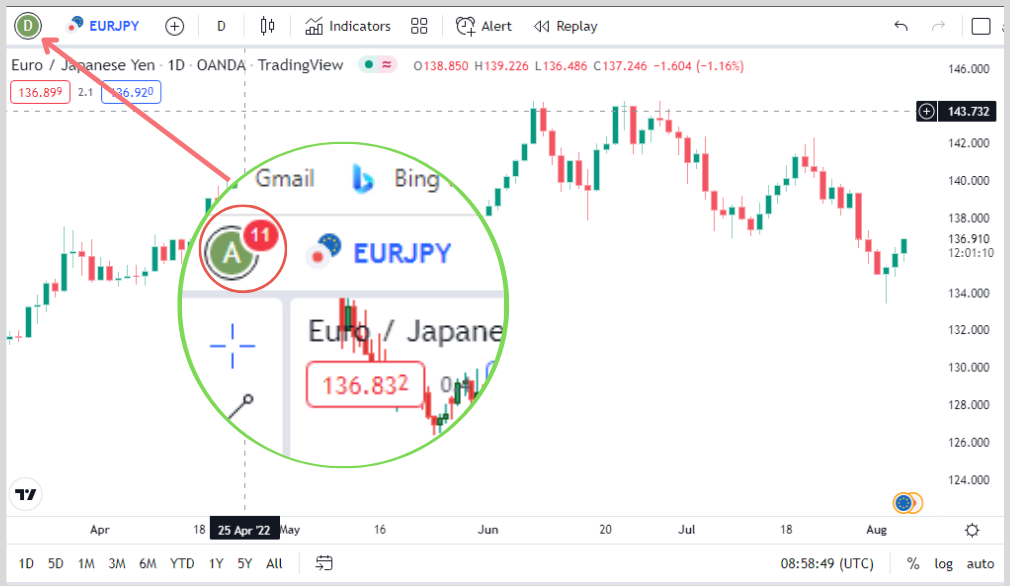
And activate the drawing panel.
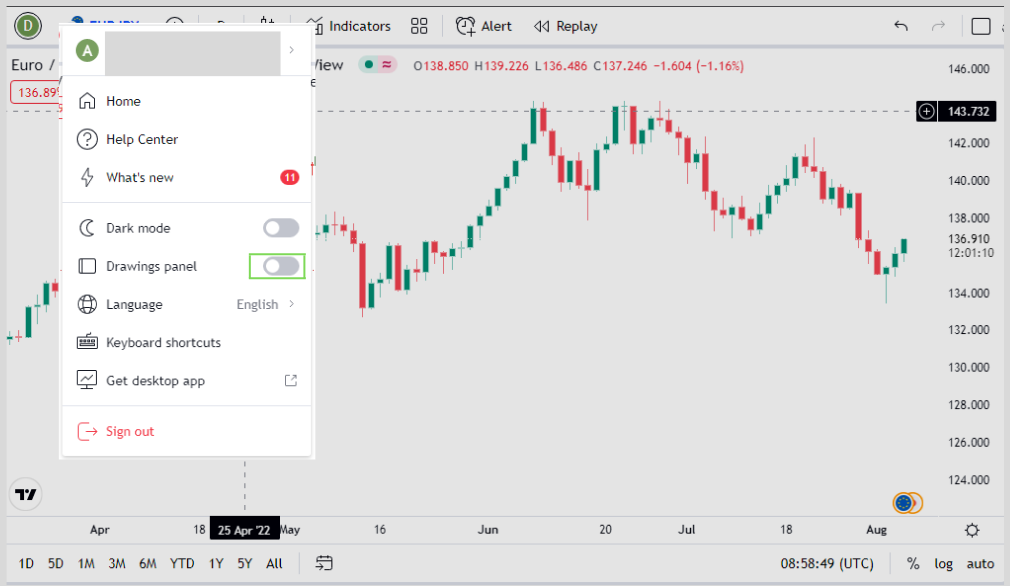
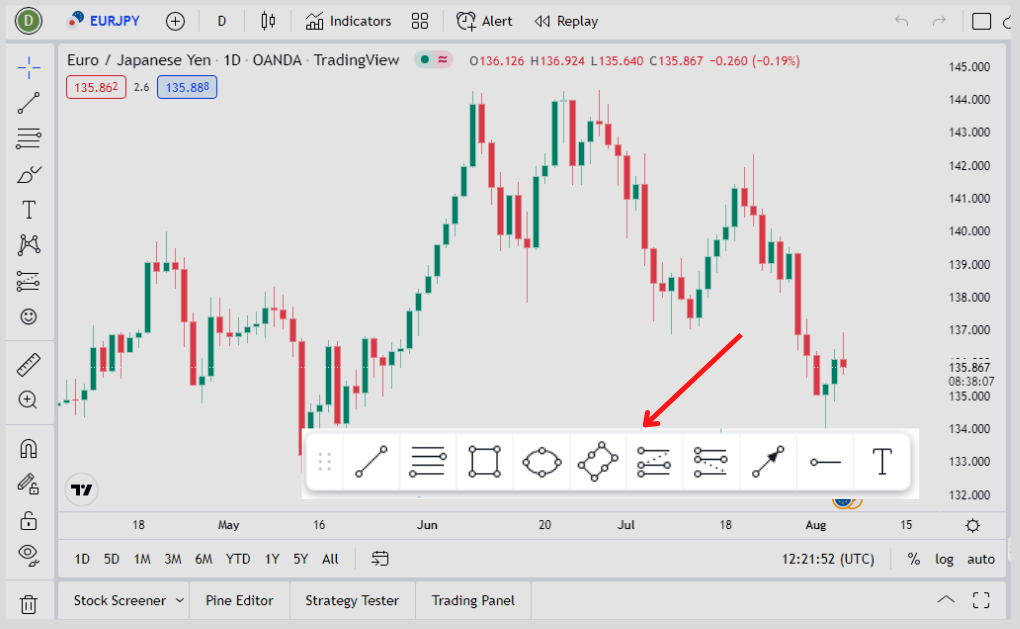
And now, there you have them in the left-hand sidebar on the charts.
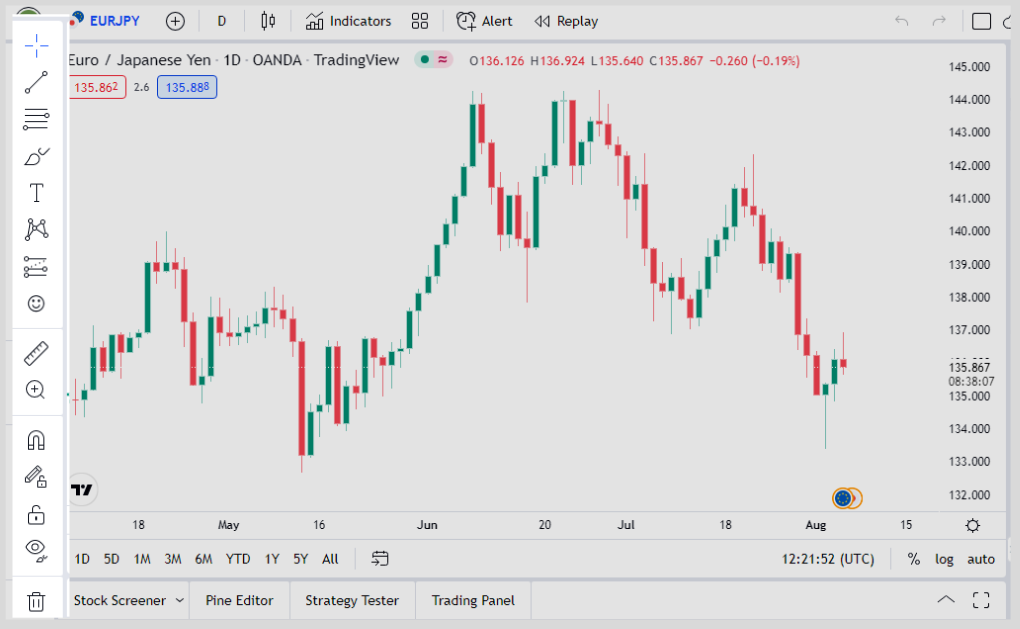
Quite a bunch of them, but I only found a few useful, which I mentioned earlier.
And they are just a few of them (6), most precisely.
You can play around with the drawing tools sections and see which one you are familiar with.
But that is just all to it, neither to say that there is a better way to add all your most used tools into a single place.
Yes, and that is why I love TradingView.
It allows you to add all your instruments into one segment as “Favourite” just like this.
The Good Part: It allows you to quickly access your trading instruments without having to use the drawing panel always.
But how can you add them to your “favorites“?
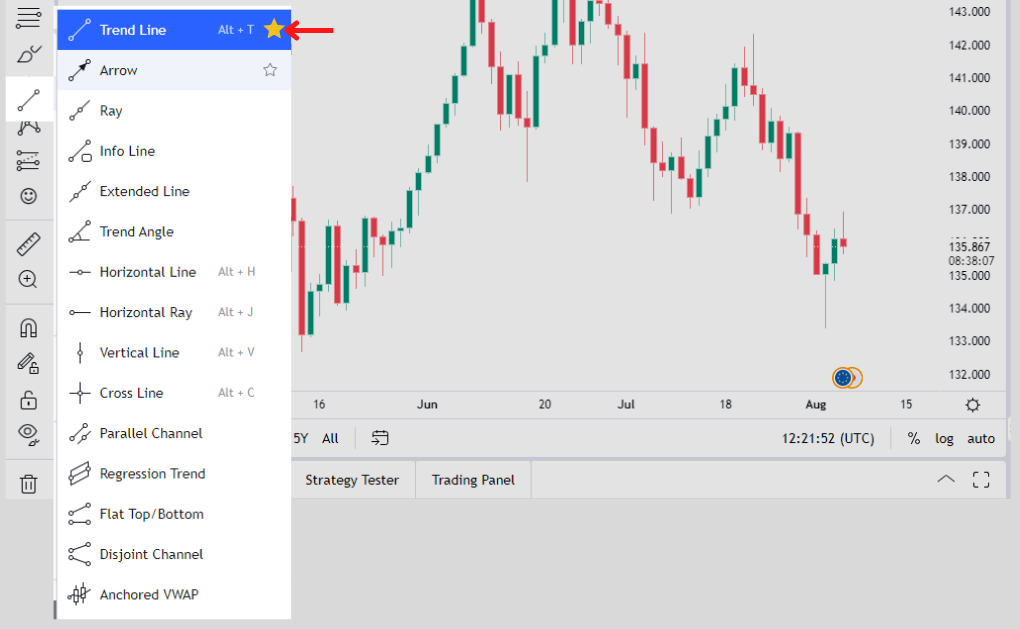
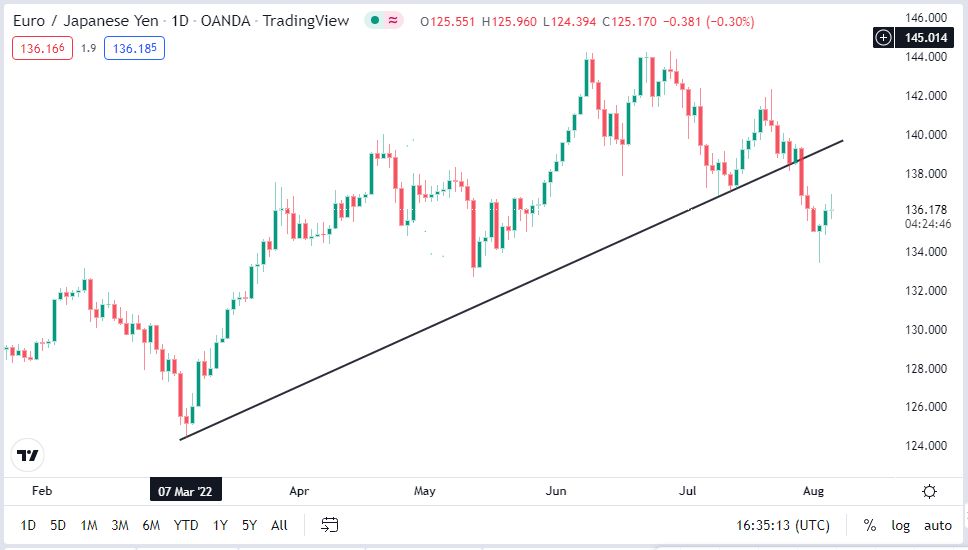
It is easy, for instance, the trendline is the most useful trading instrument.
So we want to add that to our lists; we simply locate the trendline section on the drawing panel.
Add and click the star icon to add to your favorites.
Rinse and repeat for other trading instruments
You can do that by simply right-clicking on the tool and also clicking on the “Add to Favorites” button.
Ok, there we have our nice-looking trendline.

But I prefer to go with the black color
So right-click on the trendline, and you can see a small icon like this where you can change its color and thickness.
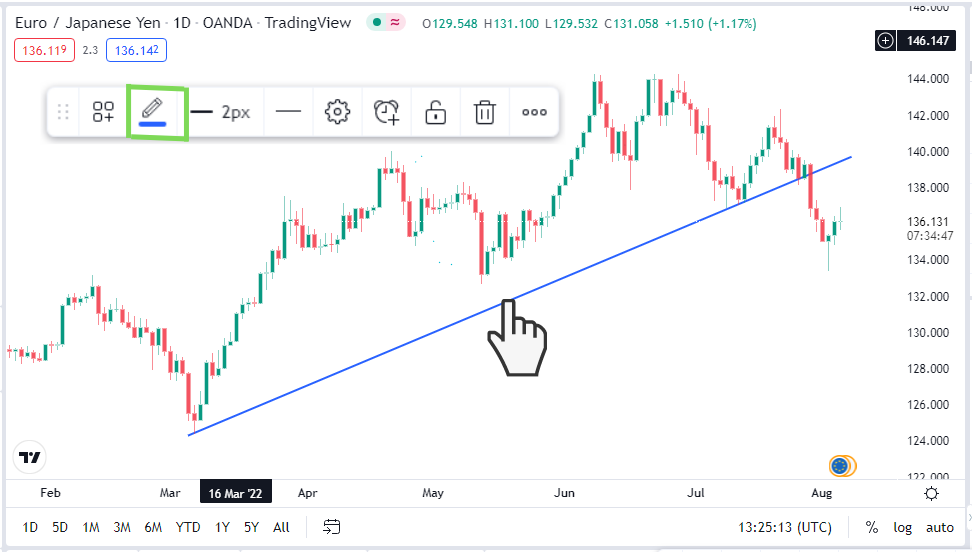
And there you have it, simple as that.
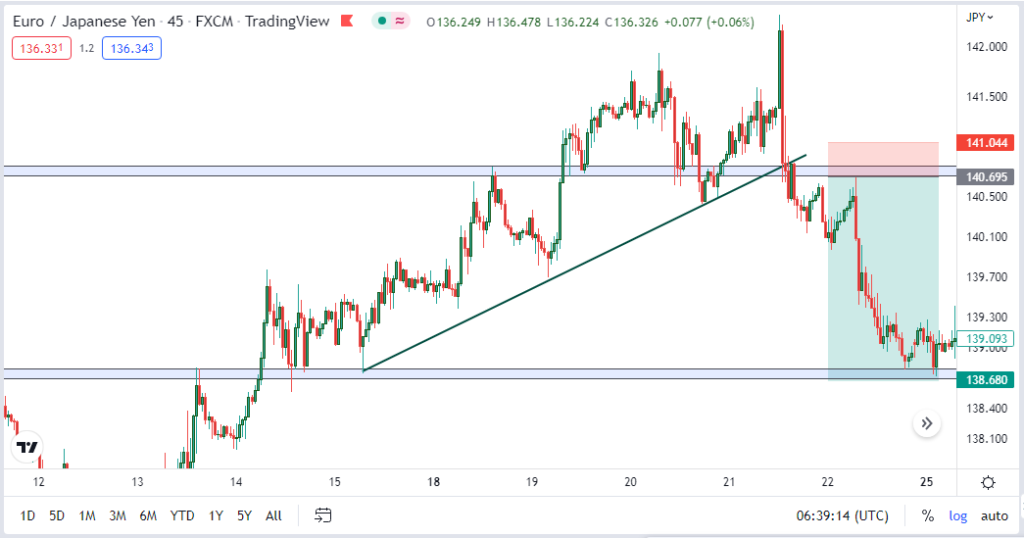
If you have been watching my videos, then you know how I usually draw my major and minor support & resistance.
Knowing how to draw support and resistance is beyond the scope of this post.
But as this article is concerned, we are only going to be talking about the instruments used in drawing them.
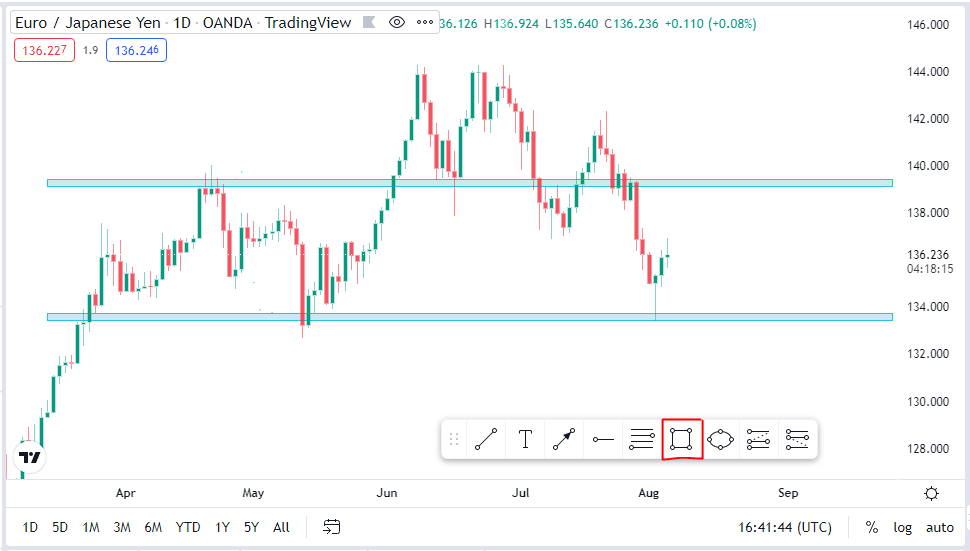
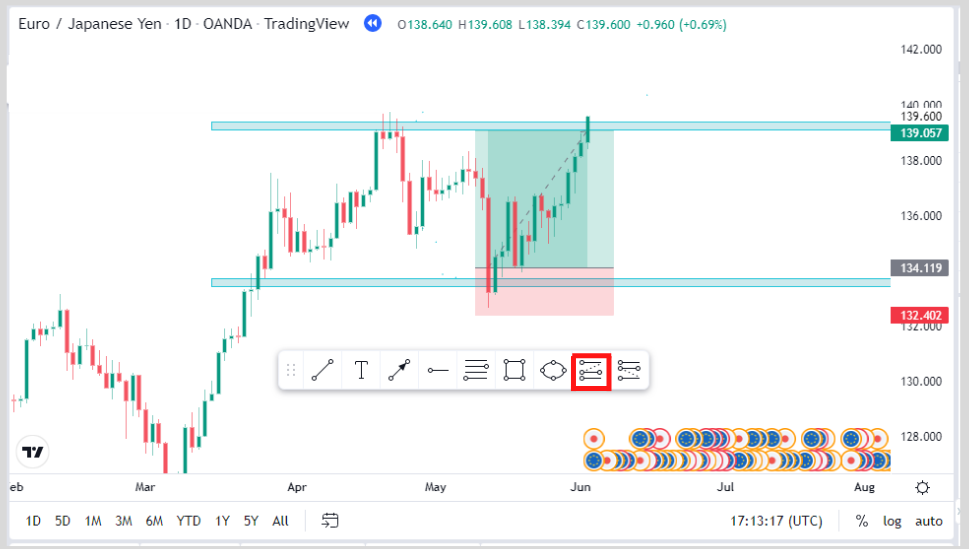
I use the rectangular block as support and resistance.
Ellipse instruments for indicating double top formations, head & shoulders, or any chart patterns.
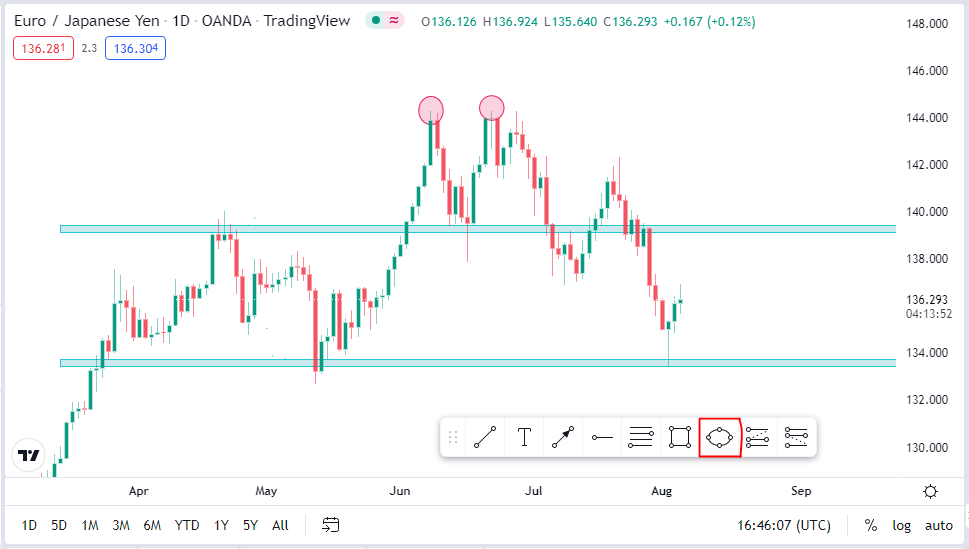
“Texts” and “Arrow” instruments for indications.
![]()
Ok, and the “short position calculator” to go short.
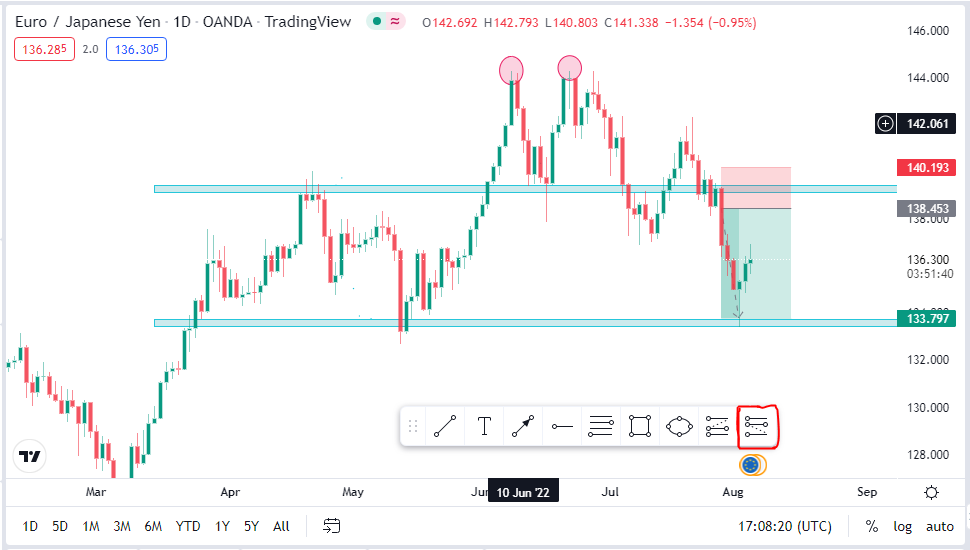
“Long position calculator” to go bullish or long.
Fibonacci retracement.
Fibonacci retracement is a significant level that can cause a significant change in price movements and trends.
I use Fibonacci retracements as confirmation for my trade, and it plays out 90% of the time when combined with price action from experience.
My significant Fibonacci level is the 0.5 and 0.618 regions.
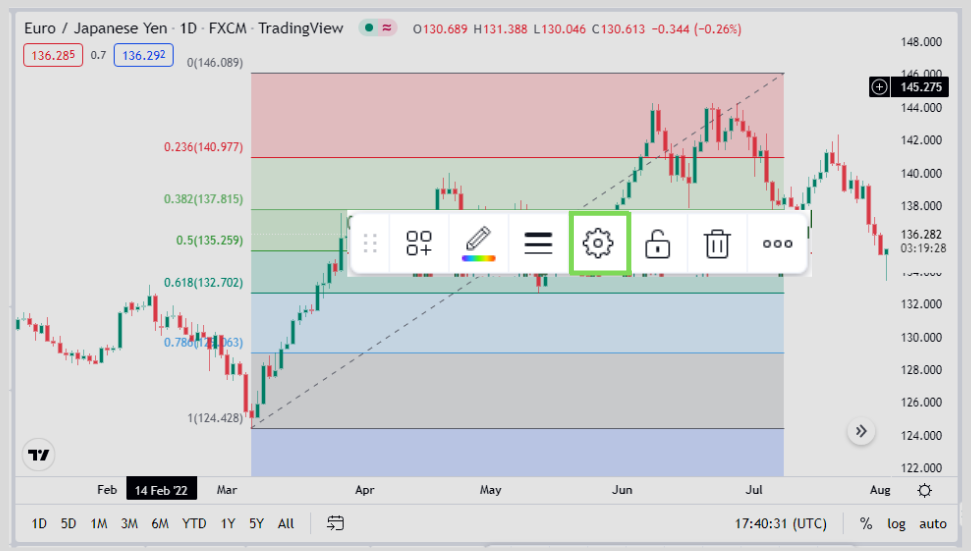
So by default, you may find your Fibonacci retracement like this.
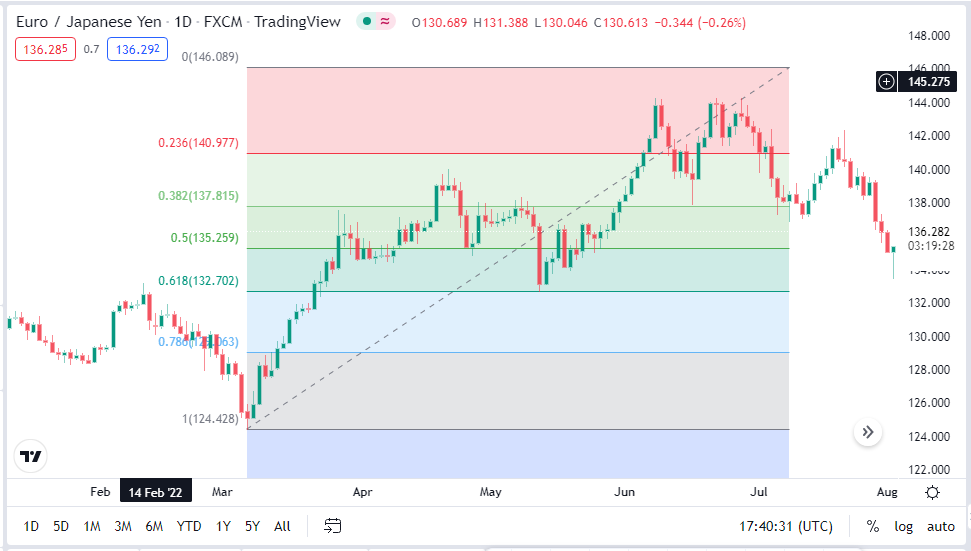
This can be distracting and also doesn’t look appealing, so instead, it should be customized in this way.
Ok then, let’s fix this.
Right-click with the cursor as shown below
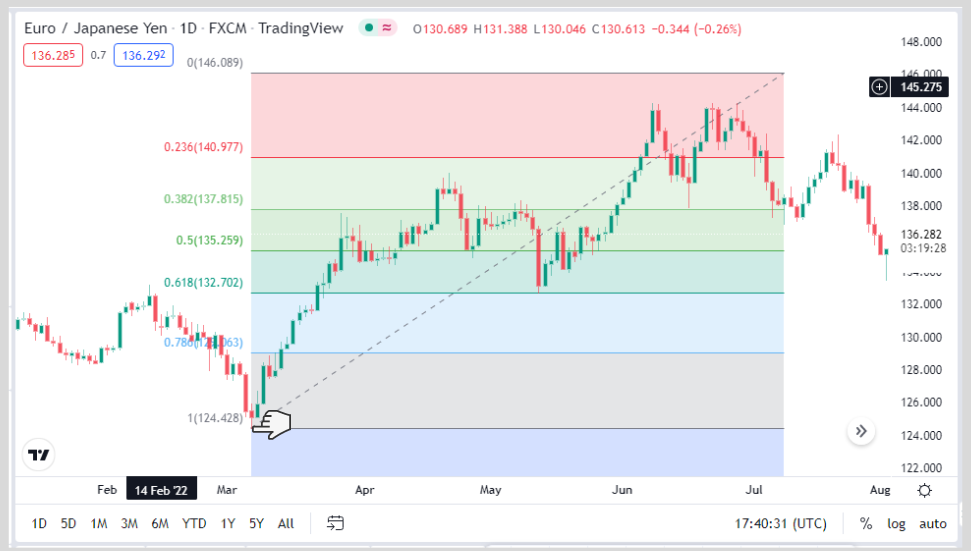
and click the settings icon as shown.
Make the following changes to the style subsection.
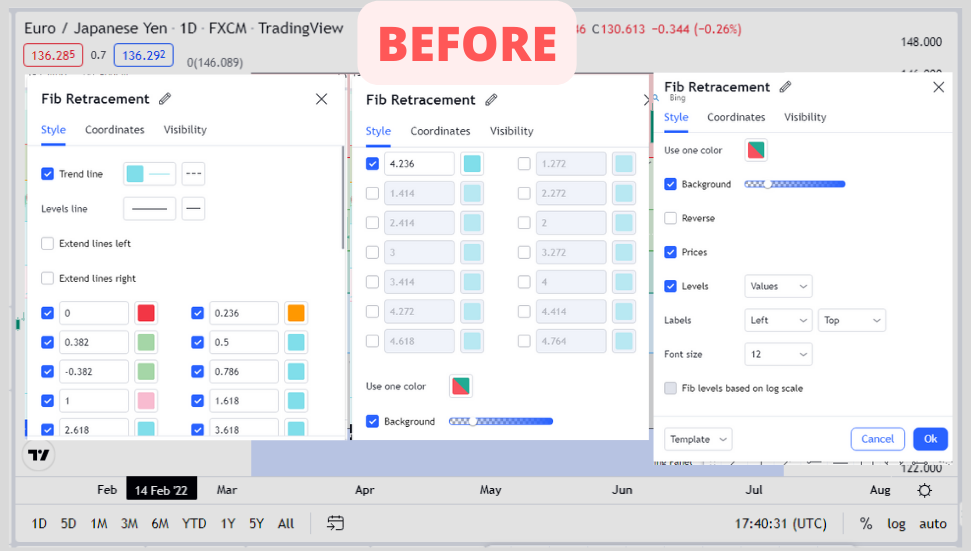
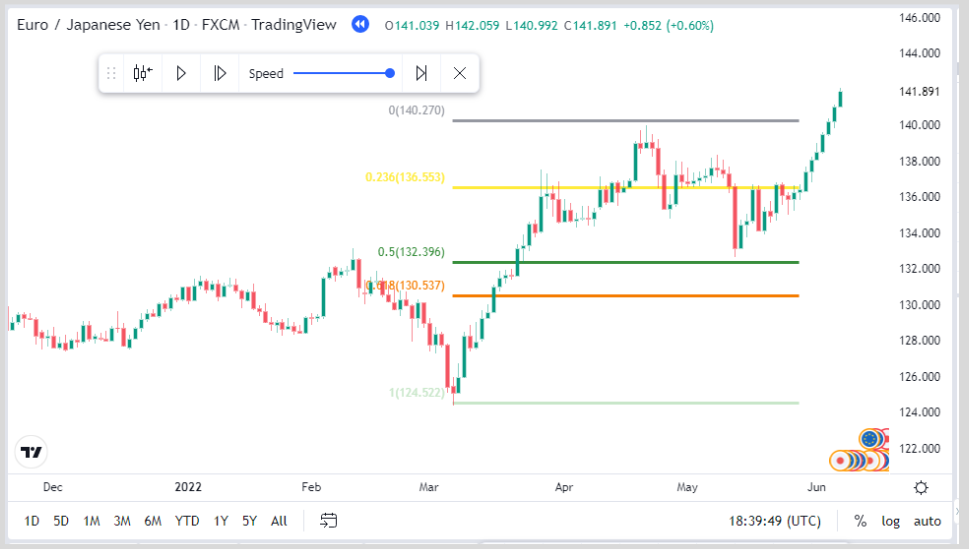
To this.
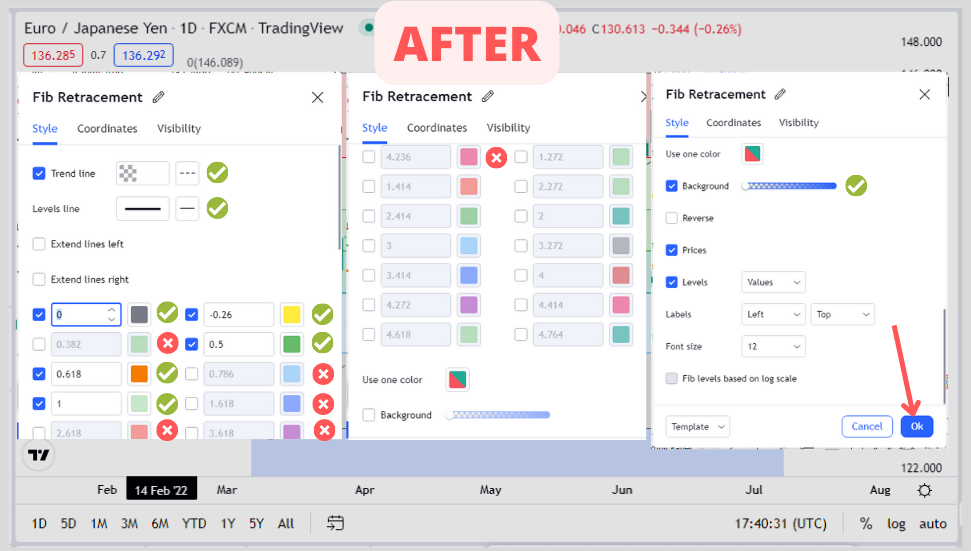
So there you have it, perfectly clean.
The levels I use on my Fibonacci are 0, 1, 0.5, 0.618, and -0.28.
The chart looks a lot better.
Beautiful!
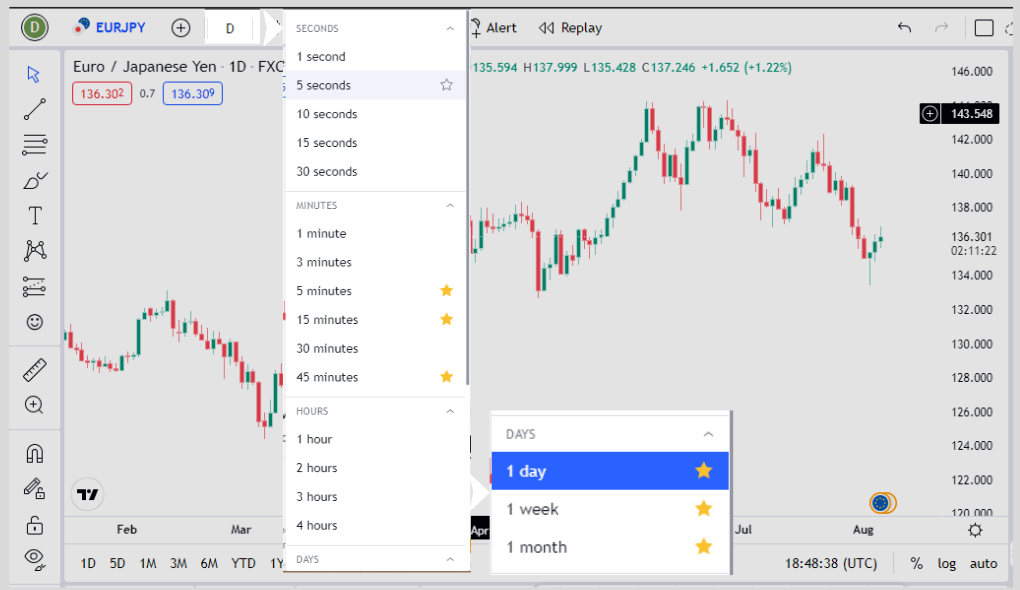
Add Multiple Timeframes to Favourites.
From displaying only “D“, which indicates the daily time frame by default.
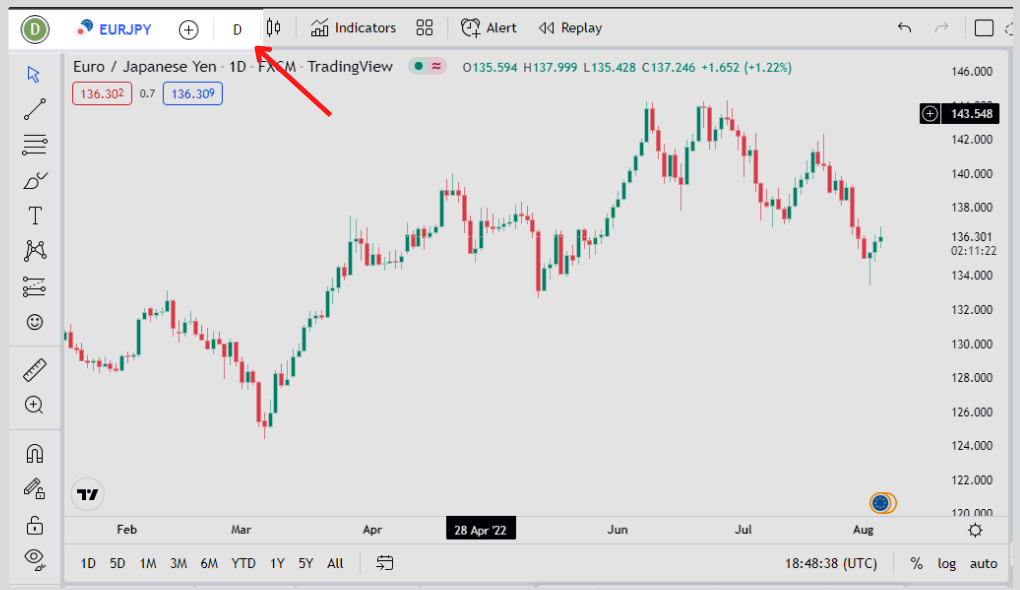
To multiple timeframes of your choice.
To achieve that, click as shown below & add to your favorites by clicking the star sections.
That said.
Other Cool Features
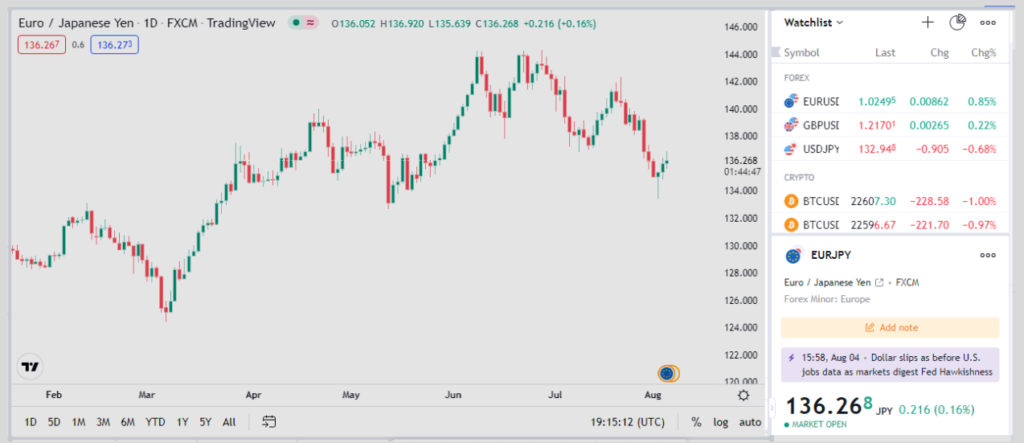
Watchlists:
Add your favorite currency pairs to your watchlist without having to search for them all the time.
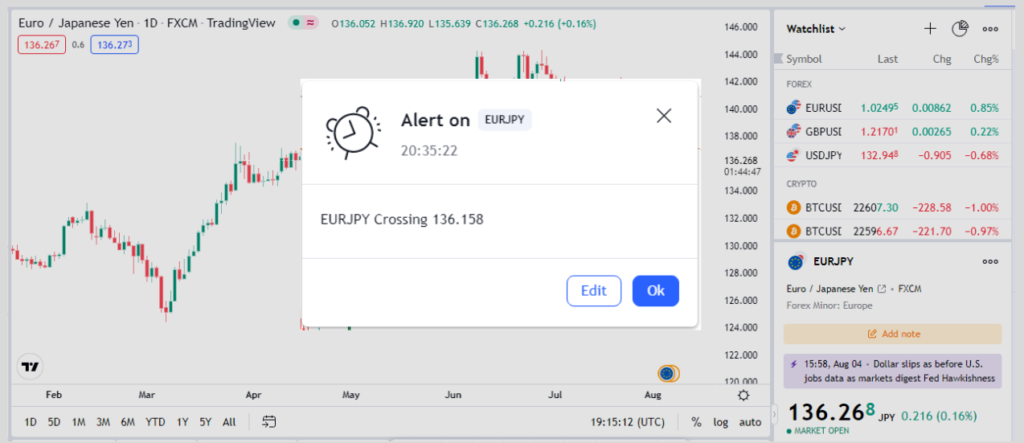
Trade Alert:
Notify you when the price hits a certain level so you can get a perfect entry point.
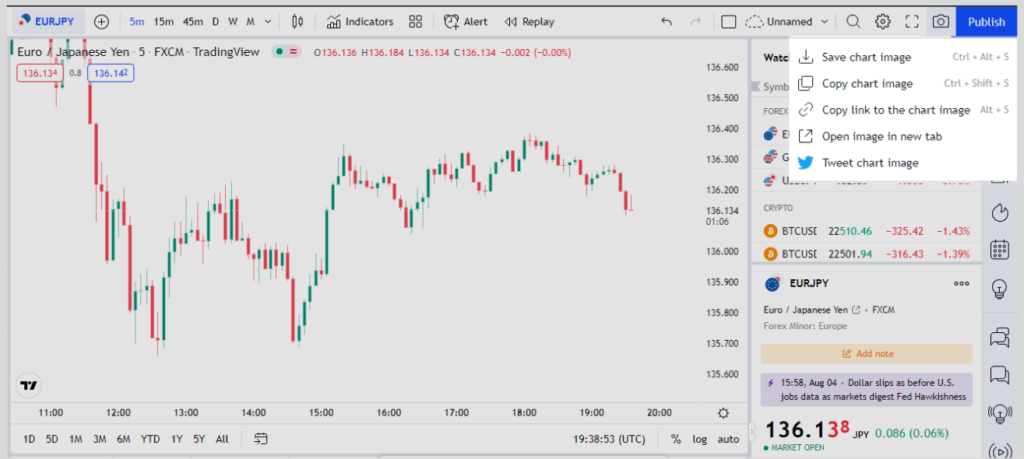
Snapshot:
Takes screenshots of your current chats analysis and easily allows you to send them to traders who want to see your analysis.
Or share to Twitter at ease.
Multiple Time Frame Layout:
Shows multiple timeframes together on a single screen.
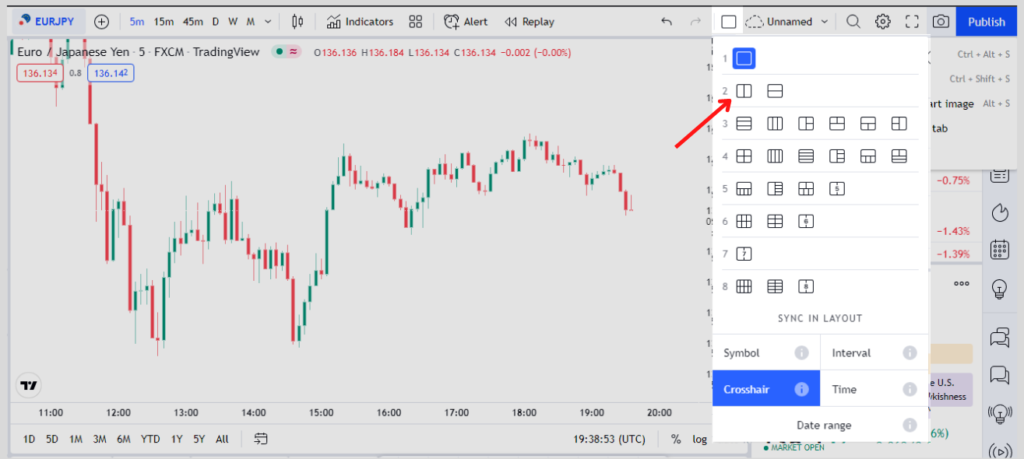
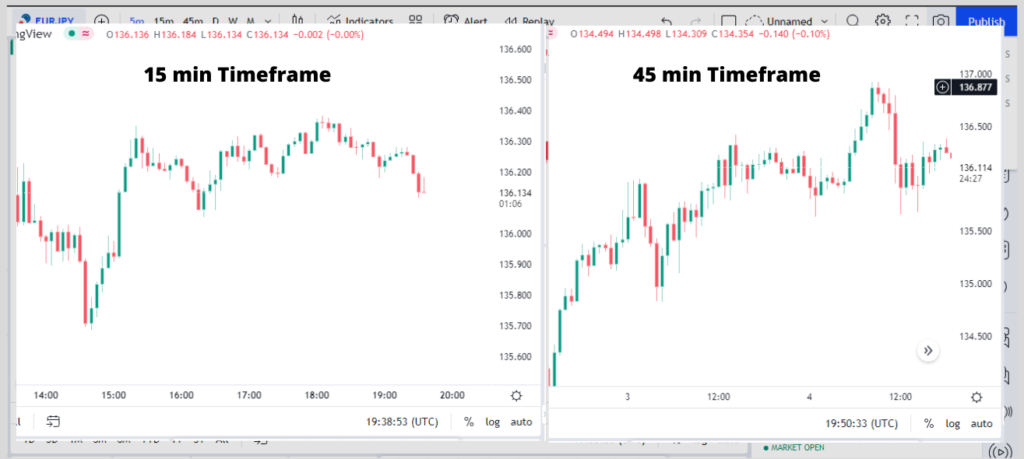
But the downside of this is that you will need a bigger monitor for this option to work.
Trading Panel:
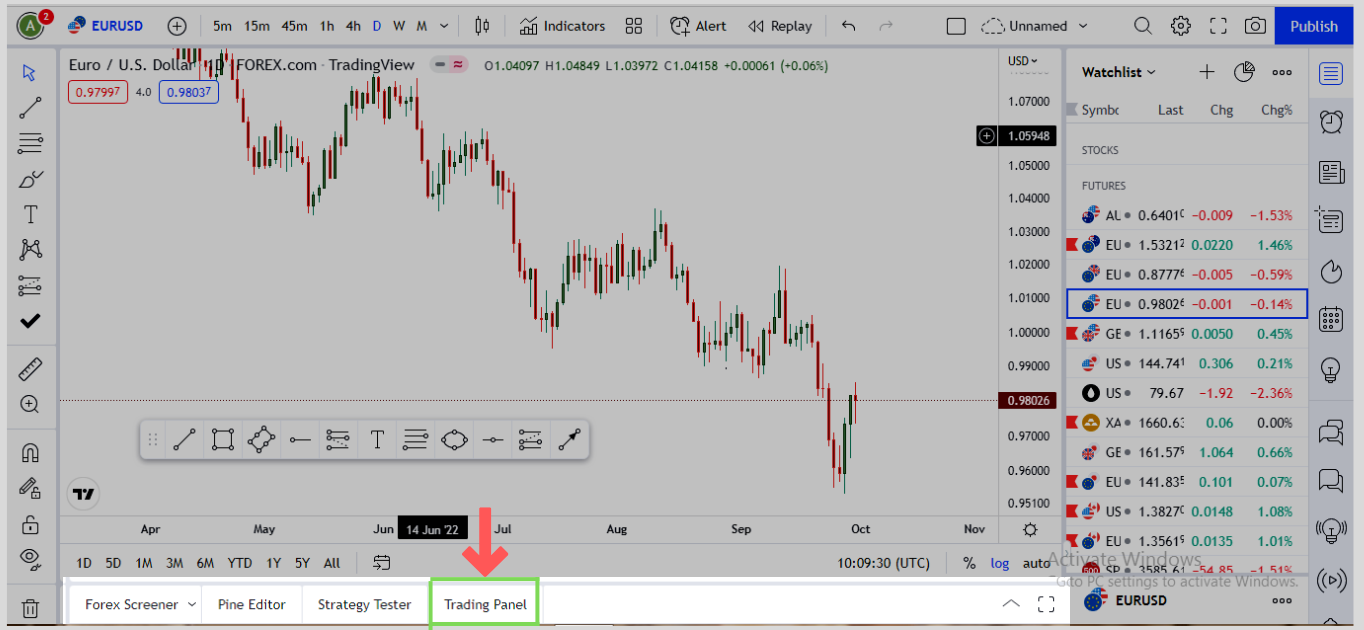
Every trader all the time uses their PC to analyze trades on platforms like Tradingview, and when it comes to executing trades, they make use of their mobile device.
But if you are these sets of traders, then you may find this Trading panel feature unuseful I would say.
But if not, it is a section on TradingView that allows you to connect directly to your brokerage firms.
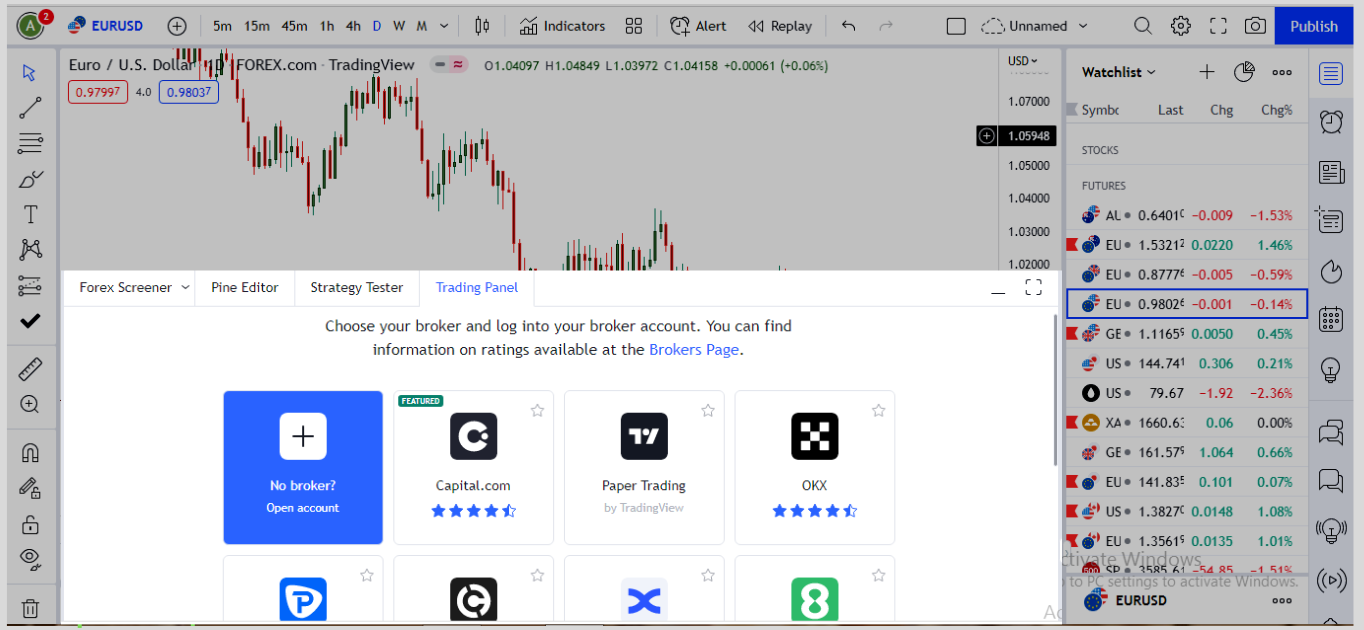
With that, you can execute trades directly on the software.
Forex Screener:
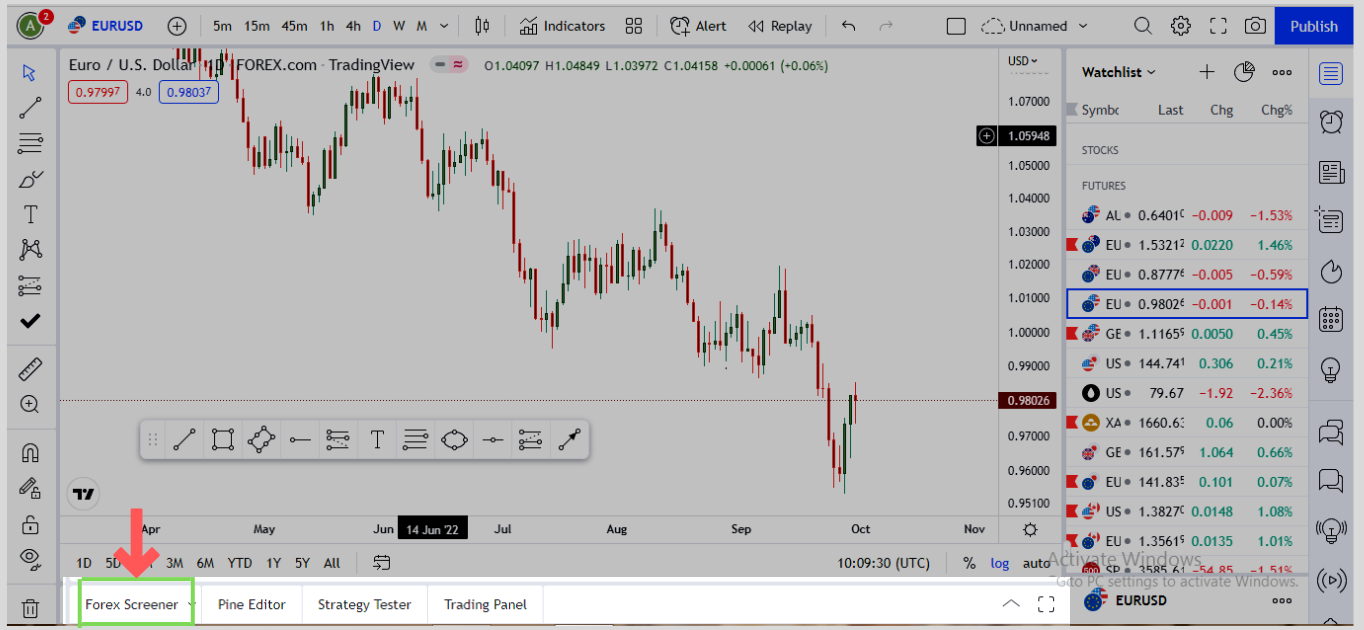
They are on the same tab as the trading panel. There is one thing many traders find interesting about this section.
It tells you the overall trends of the markets.
If the market is falling, it indicates with a signal that it is a strong seller’s market.
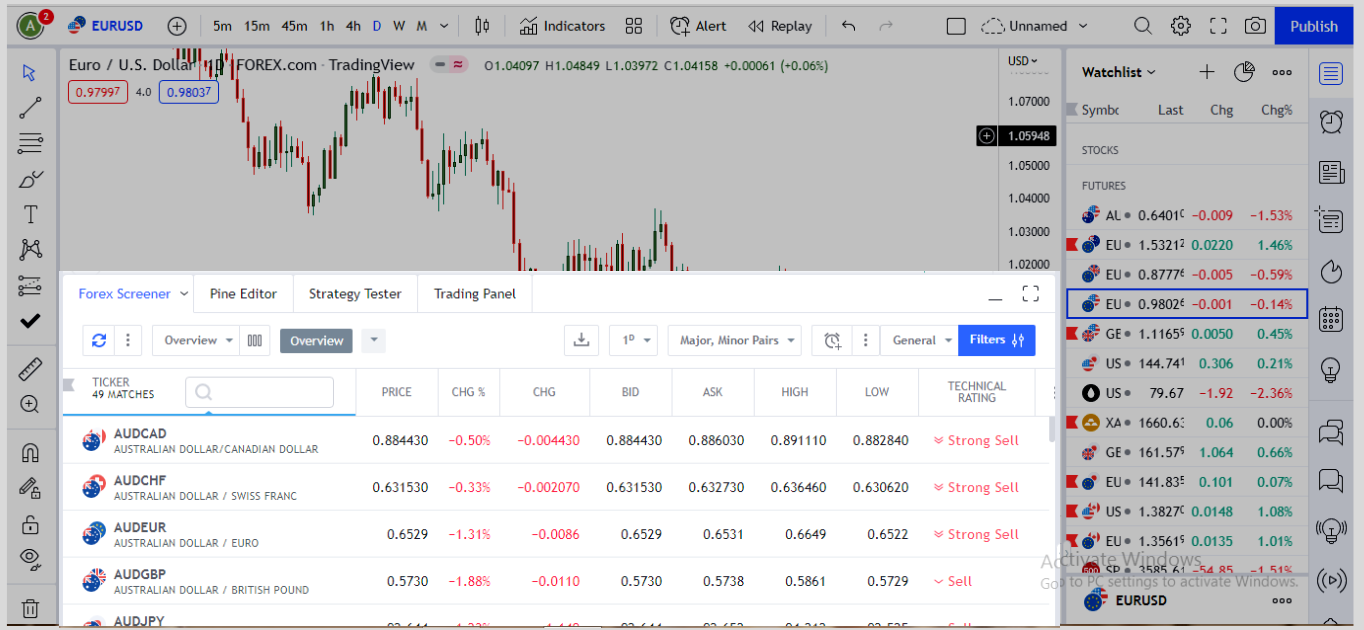
So whenever you see this, then you are one step ahead in making the right trading decision.
Conclusion
Using TradingView to analyze your chart could be one of the things you need to improve in your trading journey.
It provides you with so many tools that you can use in your analysis.
Now over to you?
What did you learn from today’s post? would love to hear in the comments.
How to set up Fibonacci retracements or add instruments to your favorite bar.
Either way, have a wonderful trading career.
Cheers.