Ever been in a trade where the market was trending for a while and all of a sudden changed its trend?
This approach is called a price action reversal, crucial for traders aiming to maximize profits by entering and exiting trades in the direction of the prevailing trend.
That leaves us with one big question:
How do you spot them early, before they occur?
Spoiler Alert: No trading methodology can spot them before they happen.
However, if a trend reversal could occur, the price always leaves a sign.
So it’s left for the trader to identify these signs and trade based on them as an advantage.
And what are these signs?
That is what we are going to cover in today’s post.
Key takeaways
- Having a deep understanding of the basics of price action is important for spotting trend reversals, focusing on price movements rather than indicators.
- Identifying the direction of the trend using tools like trendlines or moving averages helps you, as traders anticipate potential reversal zones.
- Looking for reversal chart patterns such as head and shoulders, double tops, and bottom,s can indicate a shift in trend momentum.
- Confirming the reversal with additional signals, like a break of a neckline and a retest, adds confidence to the analysis.
- Managing risks through techniques like using stop-loss orders, written profit targets, and controlling position size is important for successful trading.
- Trend reversal identification using price action empowers forex traders to enhance their trading strategies and increase their chances of success in the market.
To begin with:
What is Price Action Trend Reversal?
Price action trend reversal refers to a change in the overall direction of price trends in the financial market.
It occurs when the price of a currency pair shifts from a prevailing uptrend to a downtrend, and vice versa.
How Do You Identify Trend Reversal?
Identifying trend reversals simply involves observing some price action patterns, support and resistance levels, candlestick patterns, and other technical indicators.
By utilizing price action trend reversal strategies, traders can potentially identify market reversals early and take advantage of this approach.
To identify Trend reversals, you need to understand the following steps.
Step 1: Understand the Basics of Price Action
Price action is a way of studying the movements of the market based only on the price of a currency pair.
It’s an approach that disregards indicators and oscillators and instead concentrates on the patterns that the price makes on the chart (Learn More).
Before you can start using price action to spot changes in trends, you need to know the basics of how price action works.
You should be familiar with the notion of support and resistance levels, trend lines, candlesticks, and chart patterns.
Step 2: Identify the Direction Of The Trend
Before you can spot a trend reversal, you need to know what the market trend is in the first place.
The trend is the general direction that the price of a currency pair is going in over time.
You can use moving averages or trend lines to determine the direction of the trend.
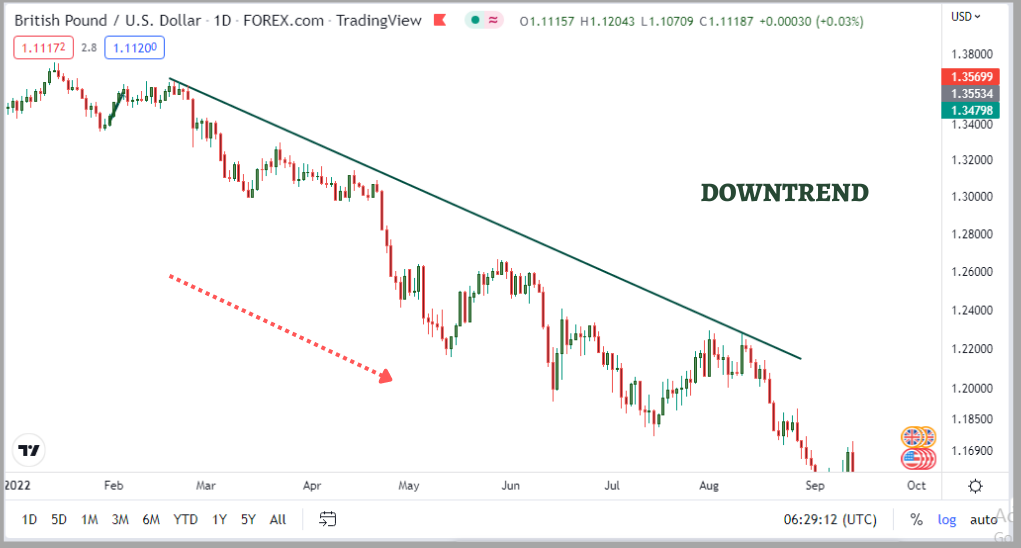
For example, the market structure of USDJPY, as shown, indicates an uptrend momentum.
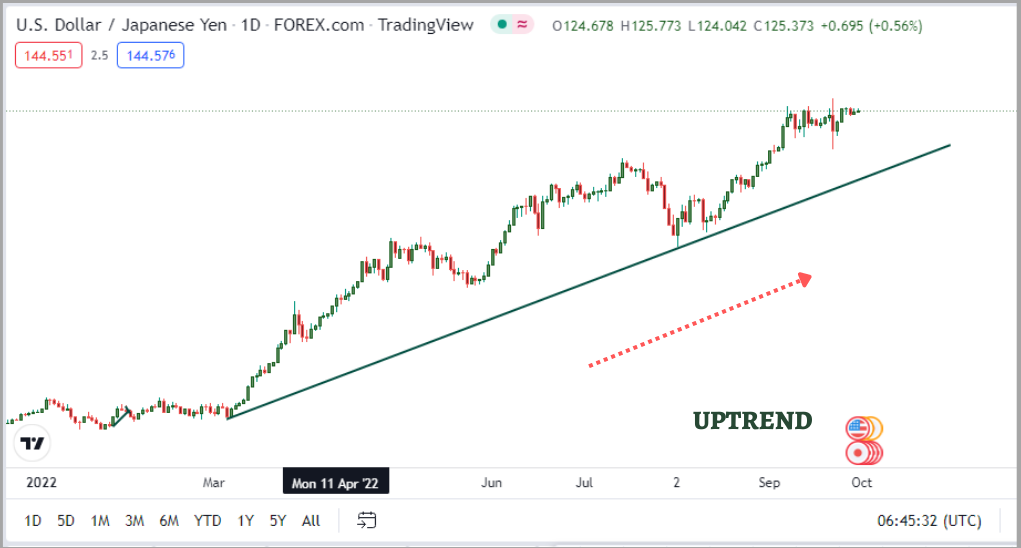
While the other represents the opposite.
Once you have determined the direction of the trend, you can start looking for potential reversal zones.
One way to identify trends is by using trendlines, which don’t rely on indicators to show us the market’s direction.
Let me quickly demonstrate how to use trendlines to spot trends.
Now, let’s take a look at this 4-Hour AUDUSD Chart as an example.
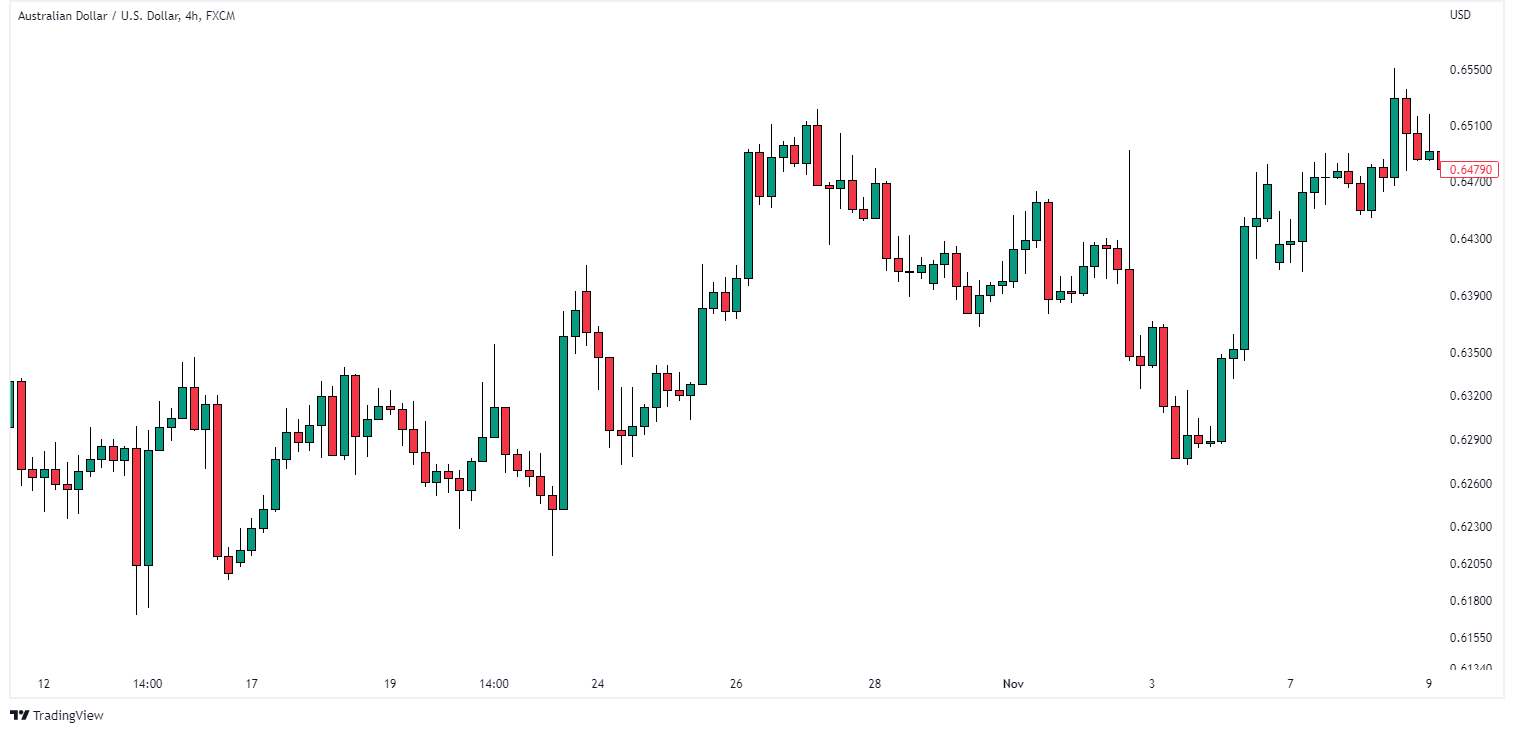
- First, identify at least three obvious external points on the chart
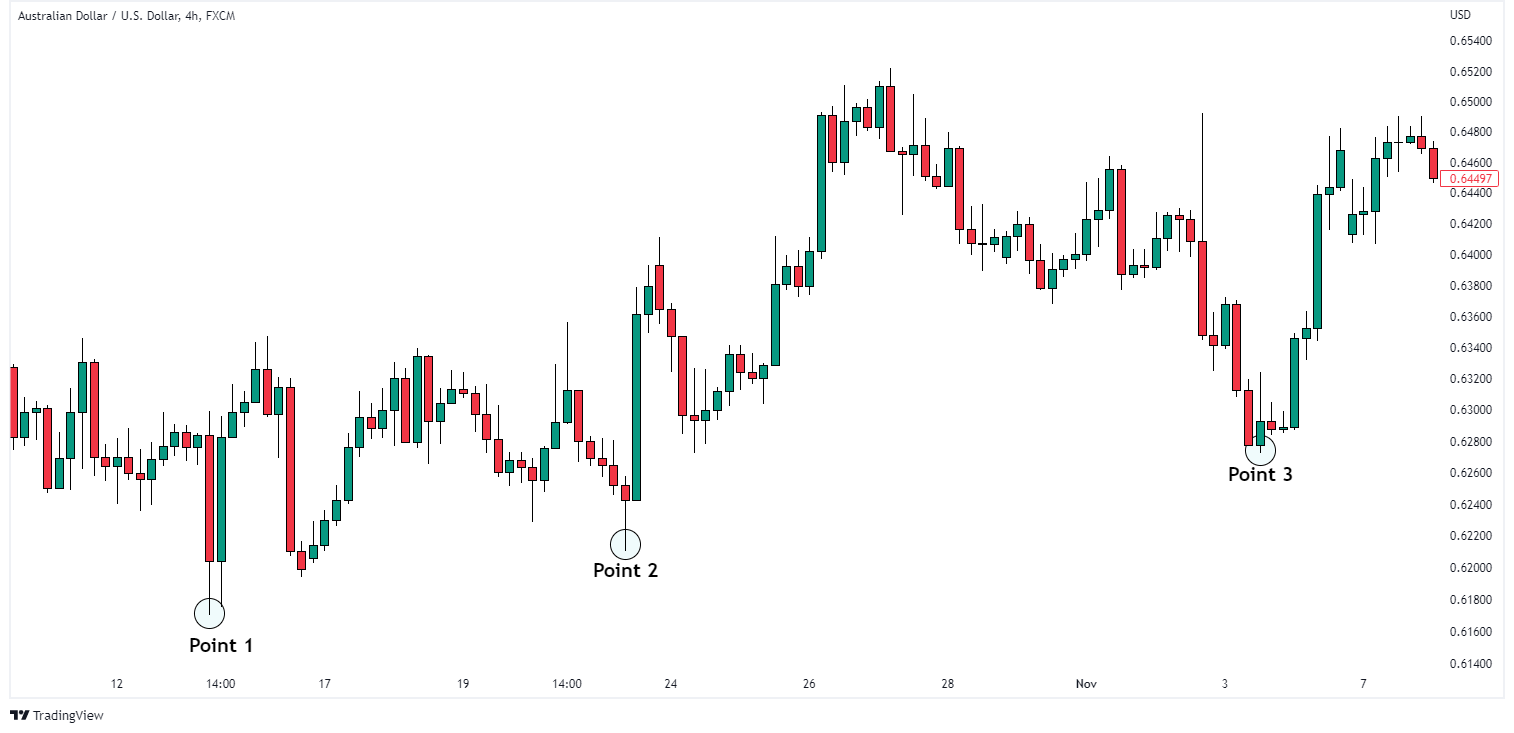
- Next, draw your trendline connecting these two points using your trendline tool.
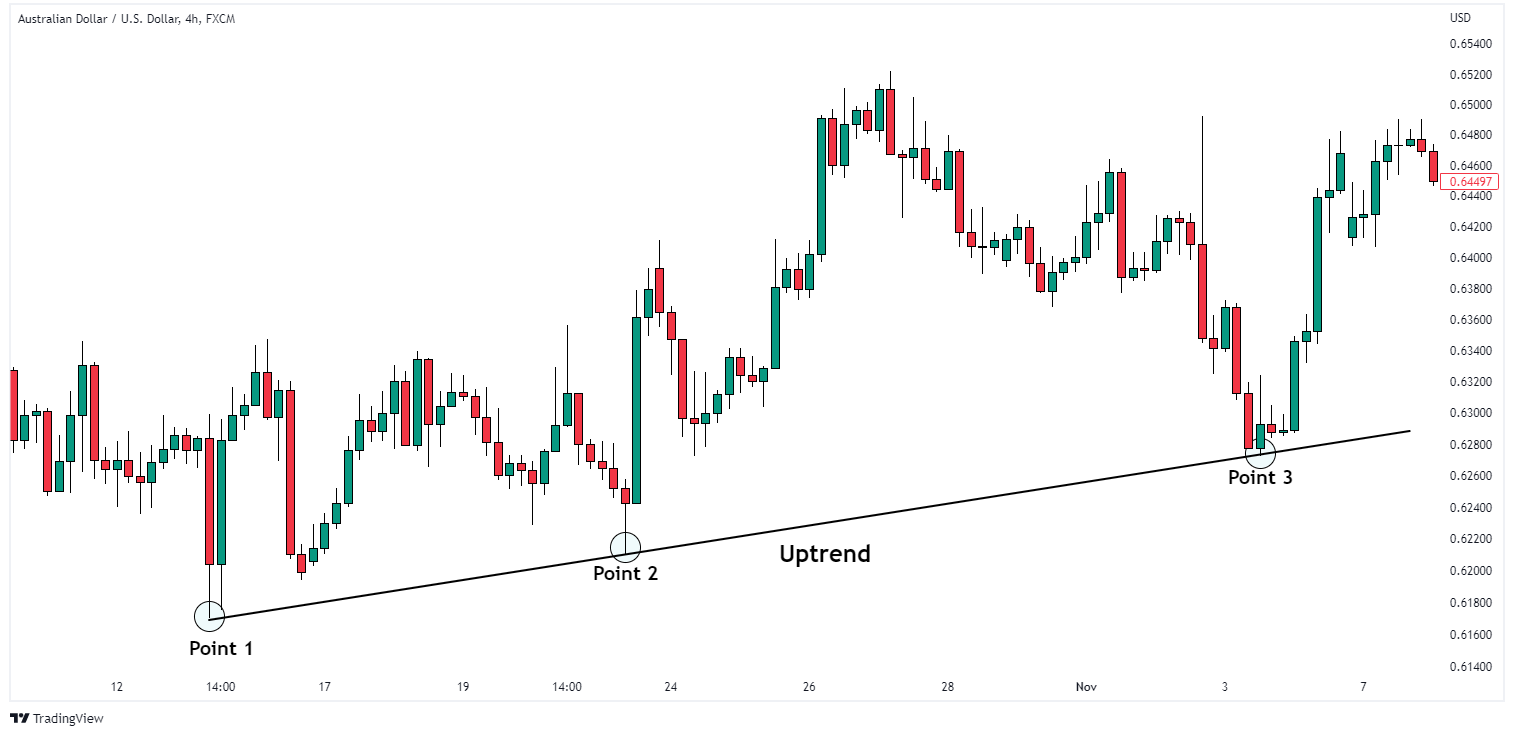
- Also, make sure that the points all connect perfectly, as you can see below.
And there you have it, drawing your trendline to identify the trend of the market.
Try out these steps on your own and draw as many trend lines as you can to identify the direction of the market.
Step 3: Look for Reversal Chart Patterns
One of the most successful strategies to spot trend reversals using price action is to look for reversal chart patterns.
Certain chart patterns, known as reversal patterns, can be used to foresee a possible shift in the current trend’s direction.
You should look out for reversal patterns like the head and shoulder, double tops, and bottoms, among others.
Each of these patterns has its distinct qualities, but they all share the same basic idea: they imply that the momentum of the trend is slowing down and that a reversal may be coming.
Let’s have a look at how heads and shoulders can signify a change in the direction of the market.
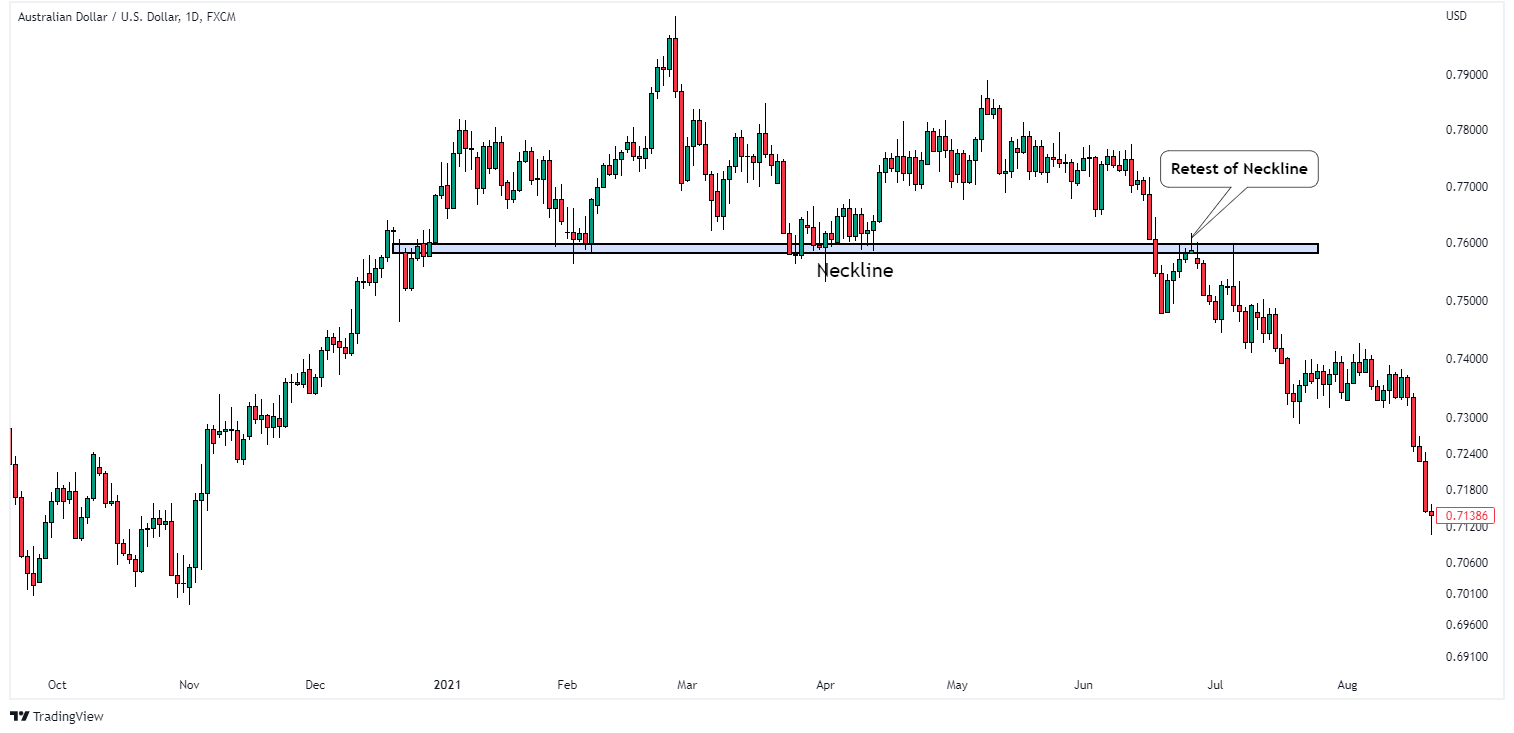
Using this AUDUSD Weekly chart as an example.
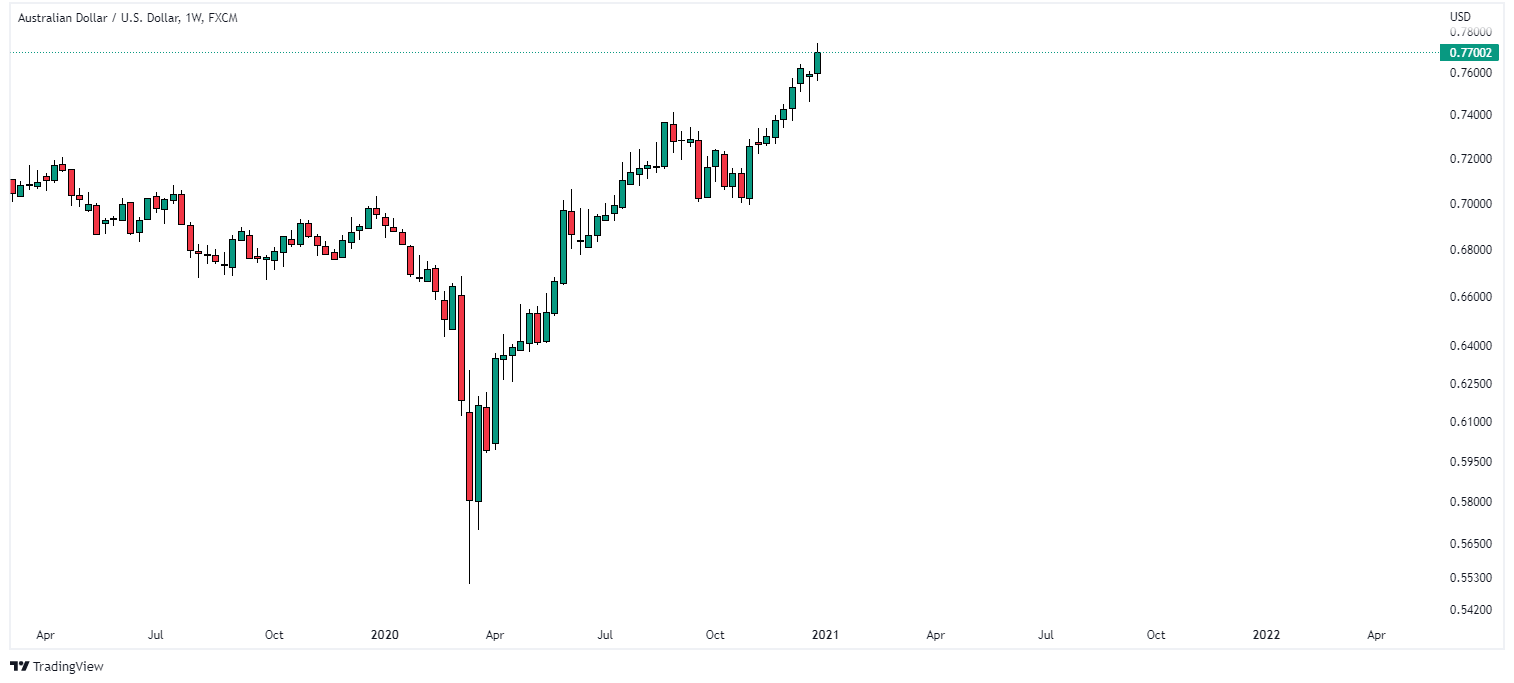
You can see that the market is in an obvious uptrend and does not look as if it would ever come down again.
But see what happens next…
On the daily timeframe, you can see that the price has formed a complete head and shoulder pattern.
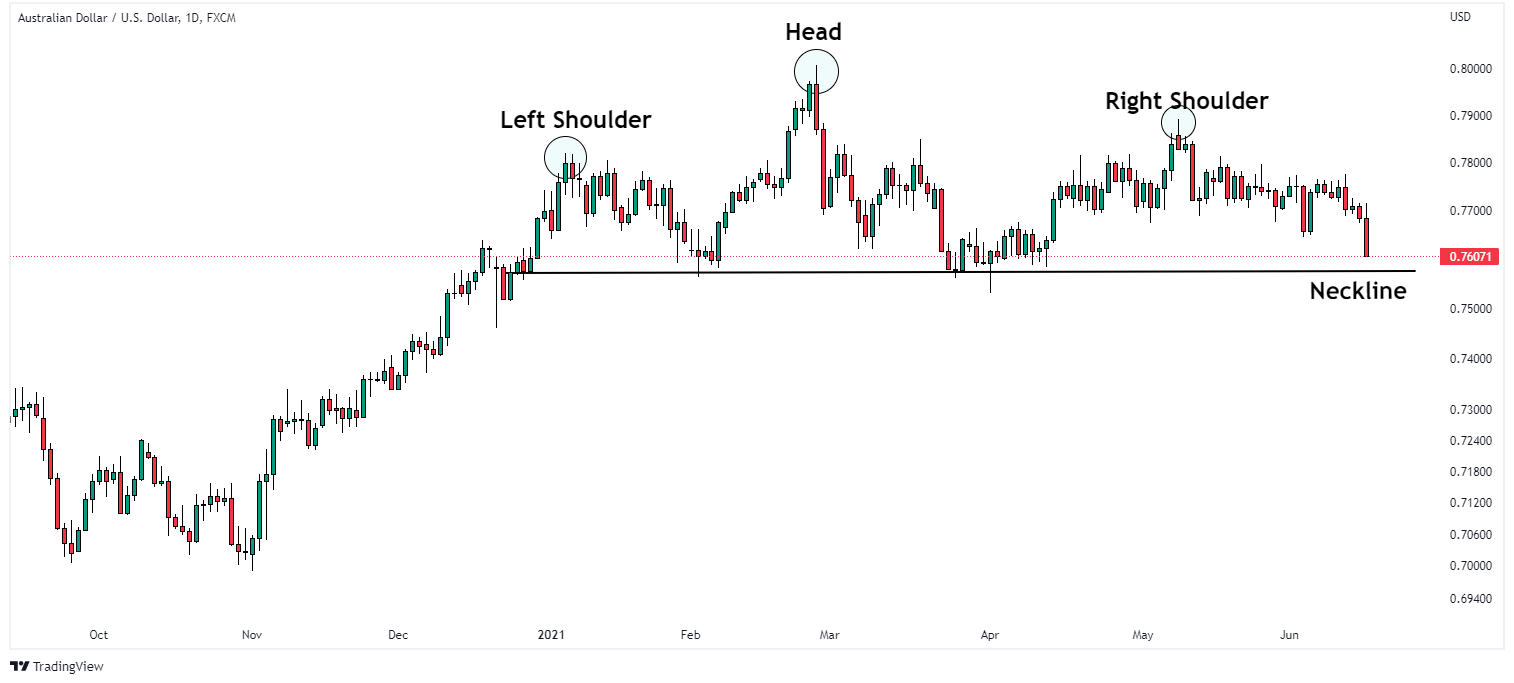
Later on.
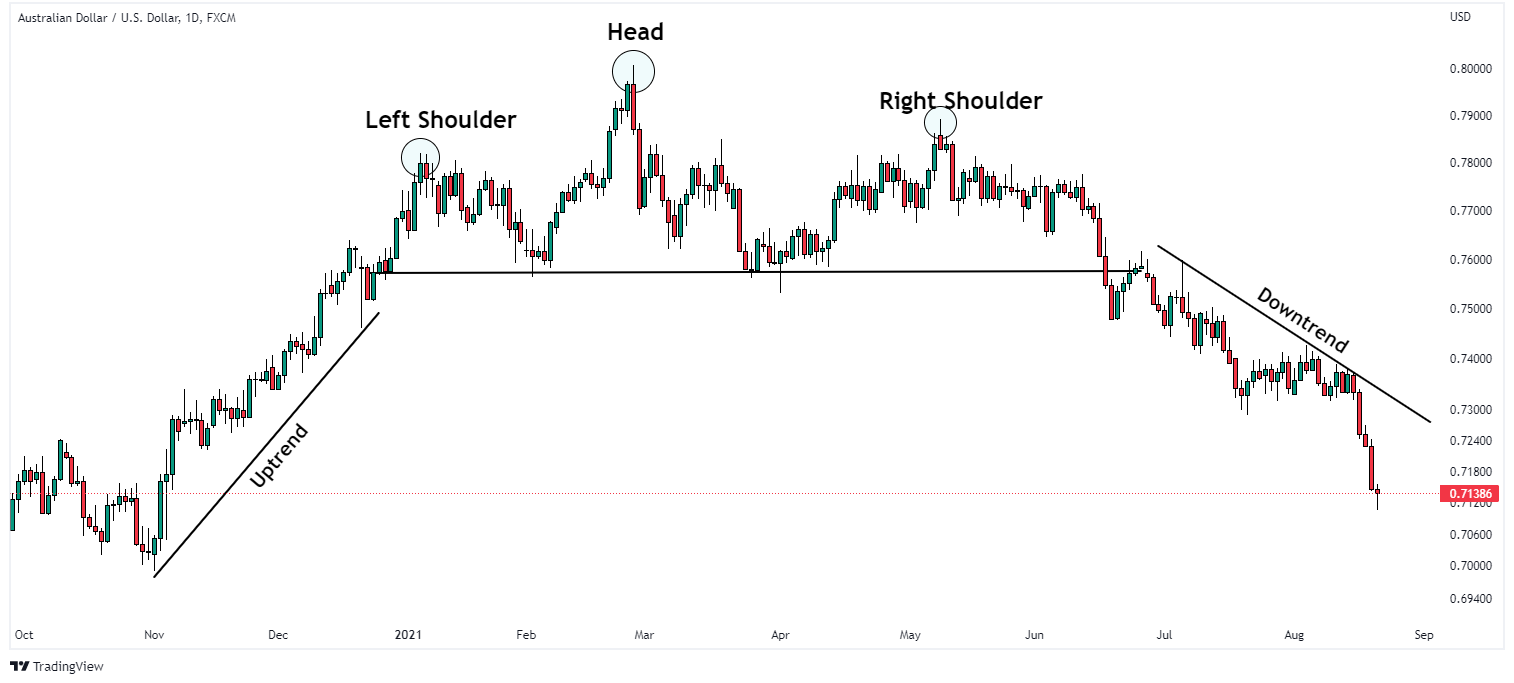
Price changed its direction totally to a downtrend, as you can see above.
This is exactly how to use a reversal chart pattern to identify a change in the trend ofthe price.
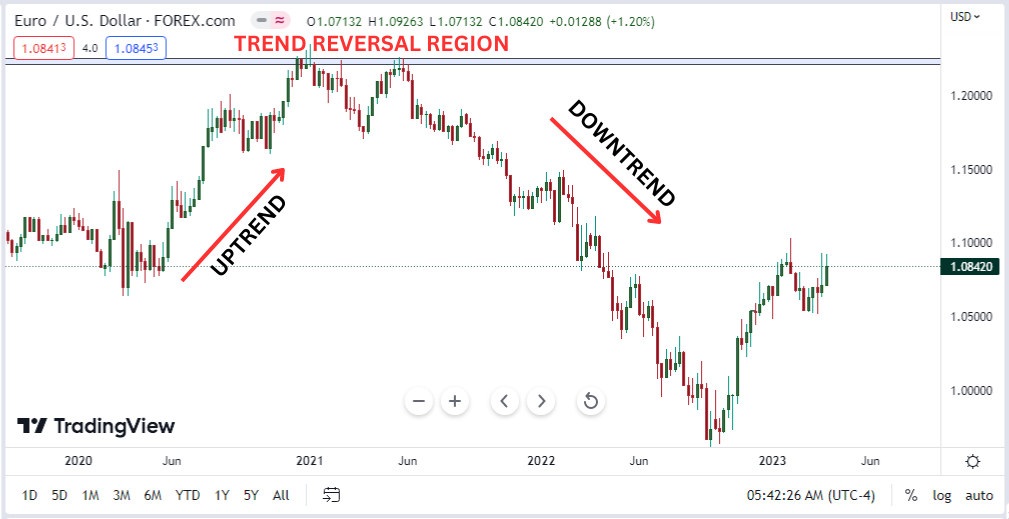
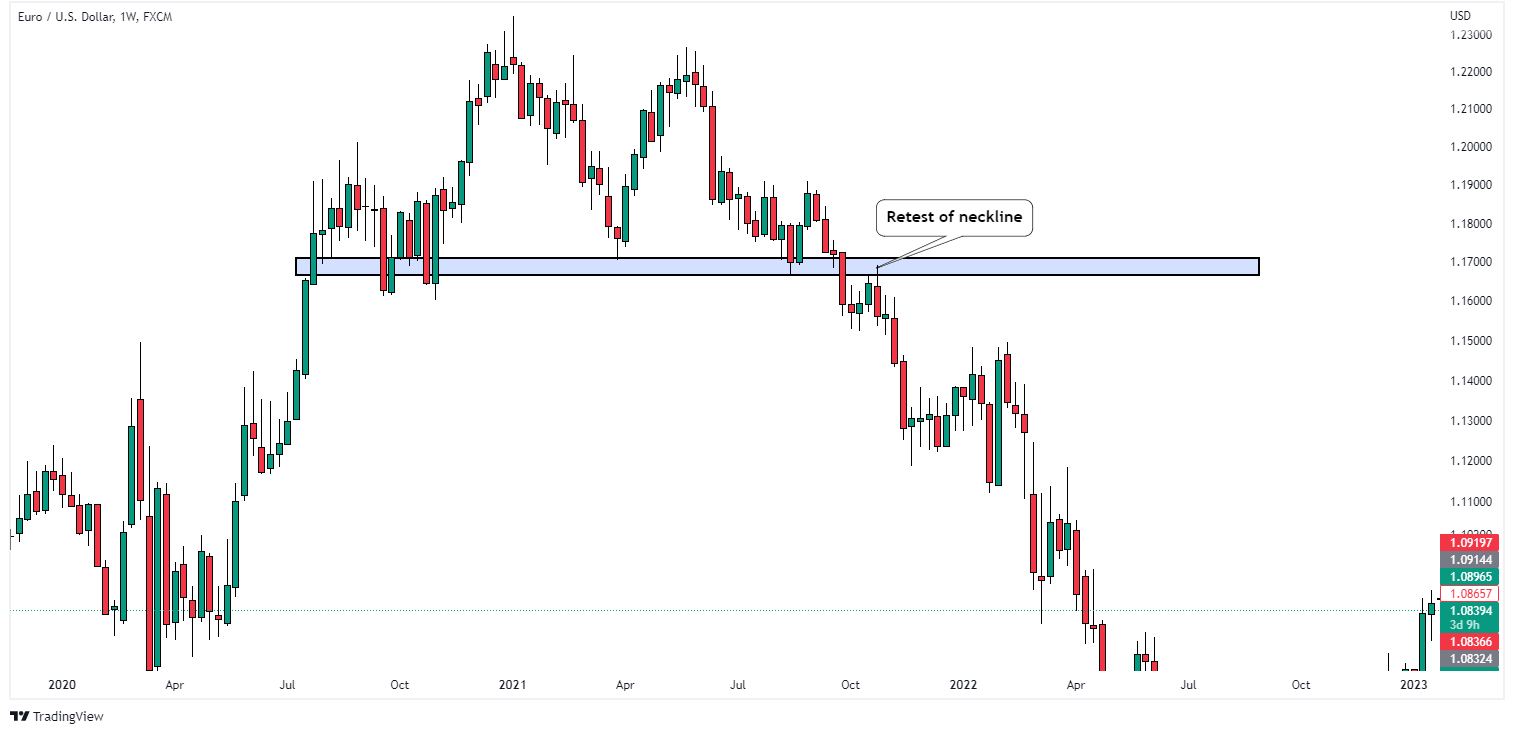
Let’s also take a look at this Weekly EURUSD chart as an example

You can see that the price was in a very strong uptrend. But after the double top had formed, the price changed its trend.
Can you see how easy it is? Just reverse chart patterns, and you’re good to go.
Step 4: Confirm the Reversal
When price tends to make reversals, it can be in the form of chart patterns.
But not all chart pattern formations indicate a potential change in trend; some could be temporary or over a long period, and others may not be a reversal.
For example, using the NZDUSD. price forms an inverse head-and-shoulder pattern and indicates a potential change to the upside.
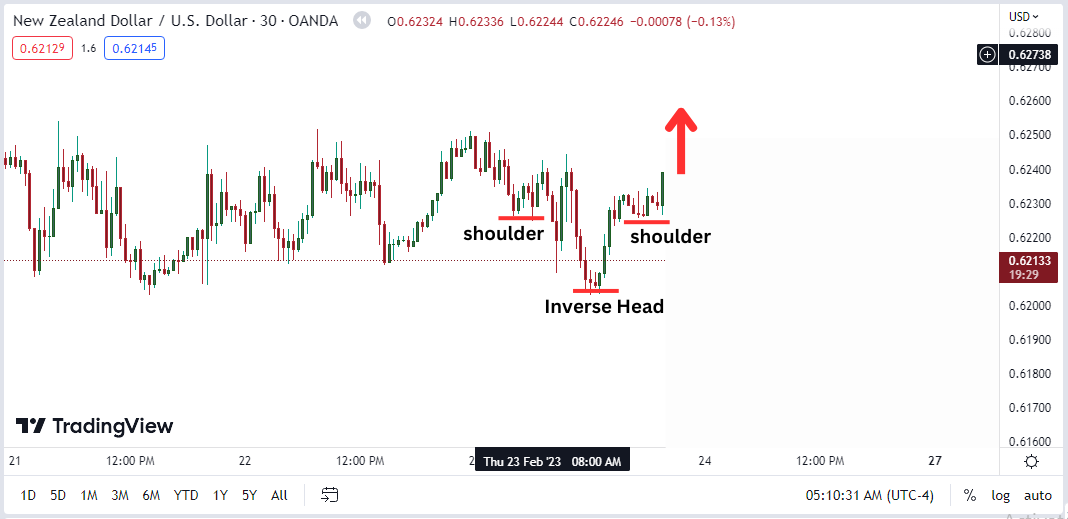
And then this happened.
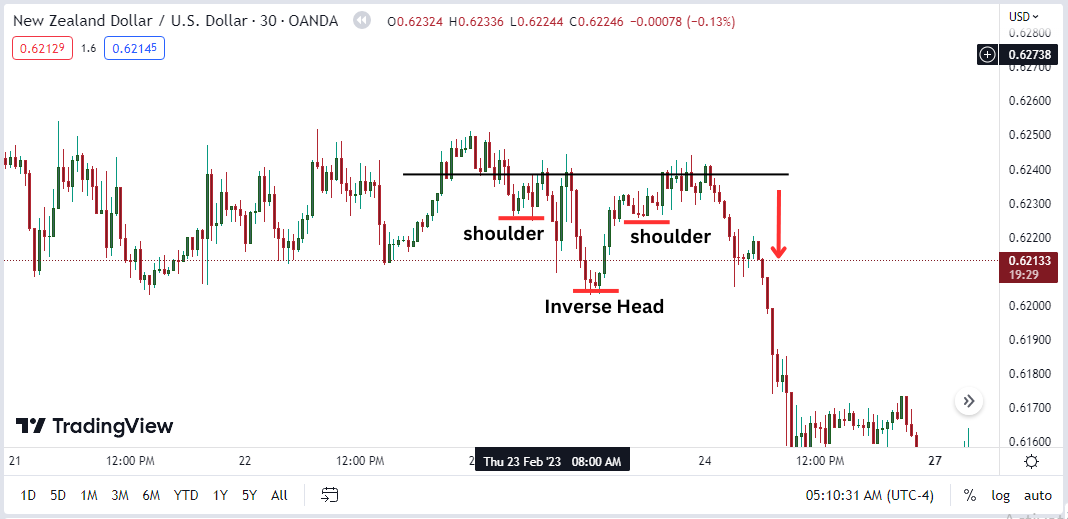
If we had traded based on these signs earlier, we would have been in a big mess.
So what do we do instead? Wait for an Extra confirmation.
What is this extra confirmation? A break-off neckline and retest.
Let’s take the EURUSD as an example.
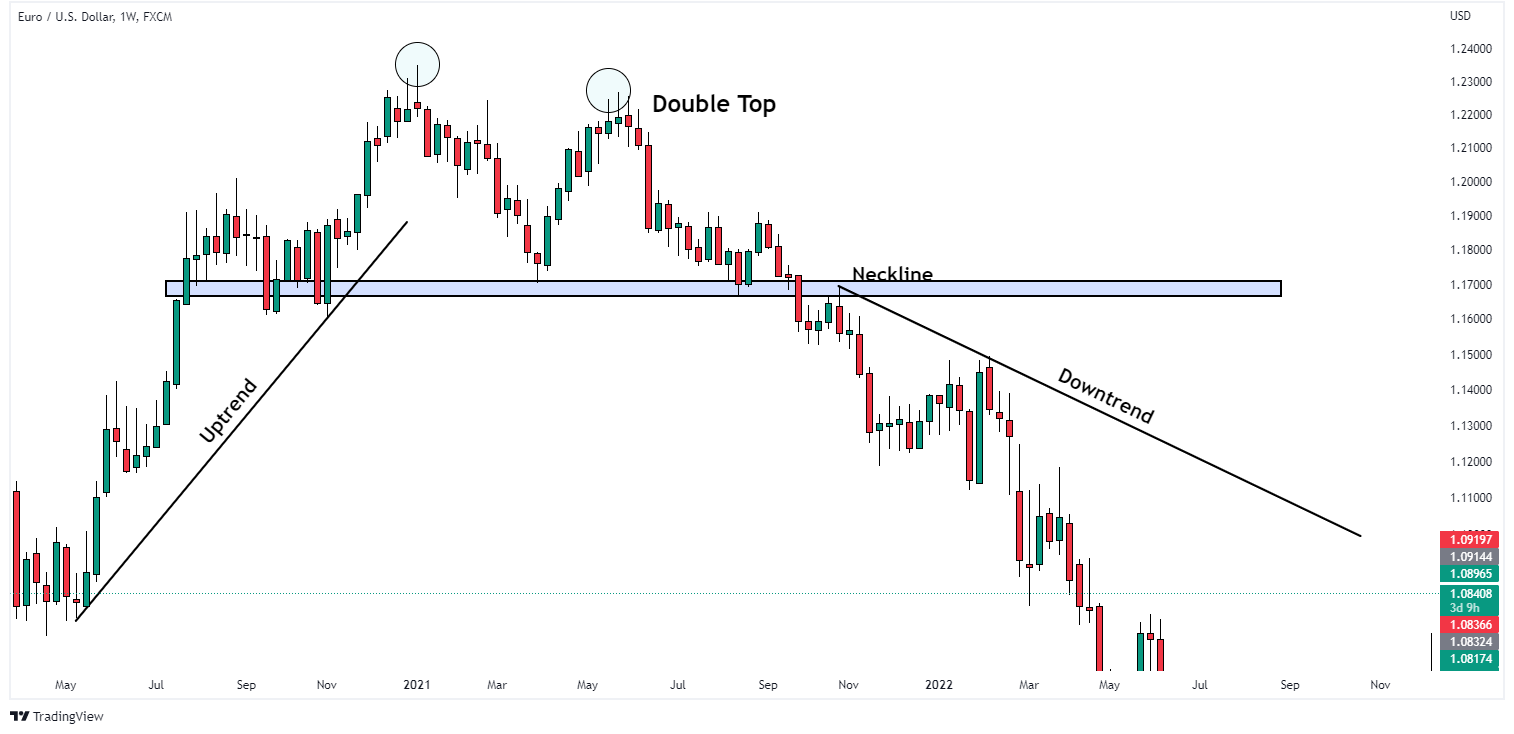
Do you see that before the trend accelerated downwards, there was a retest of that neckline?
Also, the AUDUSD chart example we used in this article. Do you see how it retested the neckline before going downwards?
Step 5: Take Control of Your Risks
Finally, it’s crucial to control your risk when trading in the forex market.
This involves using stop-loss orders to limit your losses and establishing profit goals to lock in your winnings.
When trading, it’s also a good idea to use the right position size.
This means that you should only risk a little fraction of your overall account balance on each trade, usually no more than 2% to 3%.
Conclusion
Identifying trend reversals using price action can be a powerful tool for forex traders.
By knowing the basics of price movement, detecting the trend, looking for reversal patterns, verifying the reversal, and managing your risk, you may boost your chances of success in the market.
Also, keep in mind that trading forex doesn’t have to be boring and boring.
With a happy, funny, and flexible attitude, you might enjoy learning and trading, and you might even make some money along the way!
Do take note of the various ways you have learned to spot trend reversals and how to use them.
More importantly, practice using them all, every time, to get accustomed to them.