The financial market is heavily influenced by economic news releases and other breaking news events.
Traders who rely on the fundamentals aspect of trading capitalize on these events by using a strategy known as price action news trading.
It involves identifying potential key levels and using these analyses to trade based on this news event.
Key Takeaways
- Trading solely based on news can be misleading; markets may react unexpectedly.
- Price action often leads the news, reflecting market sentiment directly.
- To trade the news effectively, focus on market direction and align trades with the trend.
- Pay attention to price action patterns on higher timeframes for potential trading opportunities.
- – The S&P 500 case study during Brexit illustrates the importance of technical analysis.
Better Misconception:
When the news turns out to be Good: Potentially rally to the Upside
When it turns out to be Bad news: The market is expected to fall to the downside
Do these misconceptions hold in the world of trading?
Spoiler Alert: No.
This is because trading based on news can be confusing, as the market may rally downwards during good news and upwards during bad news.
Therefore, it is advisable not to rely solely on the news when making trading decisions.
For instance, during Brexit in 2016, the news was filled with the massive fall of the S&P 500, making everyone on Wall Street panic.
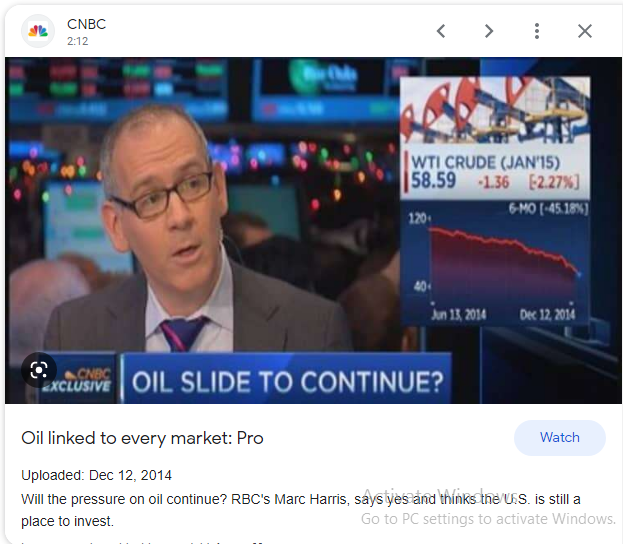
As shown above, you could tell it is a Bad one.
According to the news, the S&P 500 was actually going to collapse. which means (there is a huge potential selling opportunity), a massive fall in price.
But when we trace the charts back to 2016, the direction of price movement was the opposite.
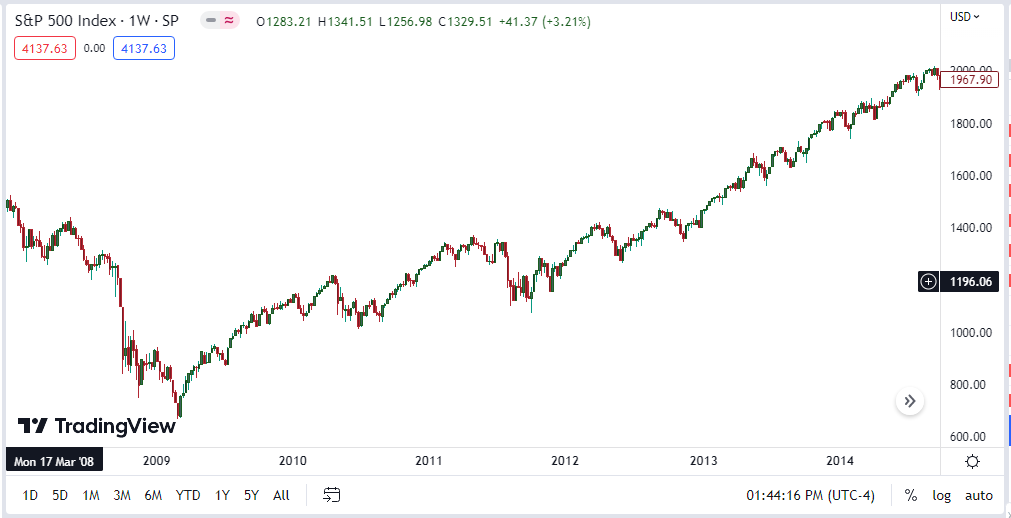
As you can see, the market has been on an upward trend since 2009, with no sign of a potential fall as the news proclaims.
That is not all.
Here is another example.
For decades, the US dollar has held the status of being the world’s most dominant reserve currency.
The situation changed when China decided to ditch the US dollar and insisted that its currency should be used for trading purposes instead.
This move by China has influenced other countries such as Russia, India, and six other nations to follow suit and abandon the use of the US dollar (learn more).
Consequently, this has led to a continuous decline in the value of the US dollar over time.
Where $1 in 1913 is now equivalent to $26 in 2020 due to the increase in the money supply.
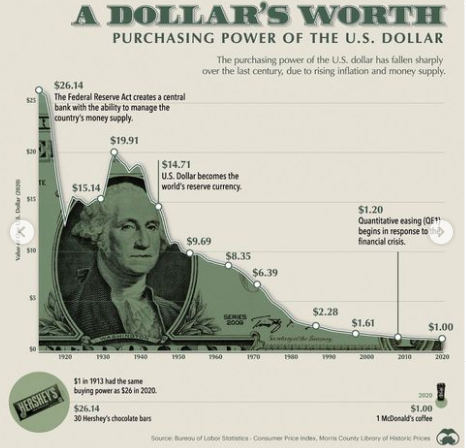
The purchasing power of a currency is determined by the number of goods and services that can be acquired using a single unit of the currency, and the increase in the money supply by the government has led to a decline in the value of the dollar.
This situation might appear unfavorable for the US dollar, but contrary to expectations, the direction of the dollar on the price charts was the opposite.
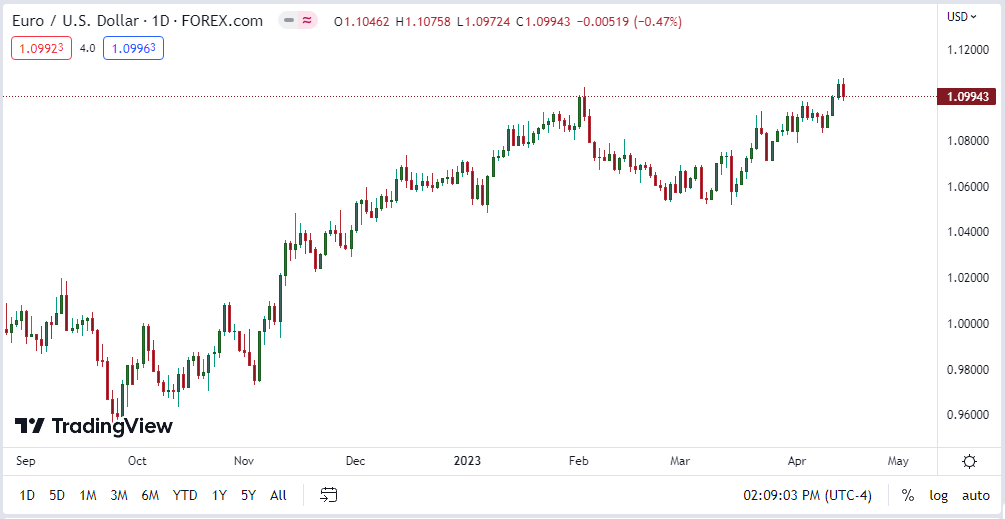
The US dollar is still going up from a technical standpoint.
What does this tell us?
The market can rally on bad news and go down on good news.
With all these Misconceptions, which should I focus on instead? Price action, because price always leads the news.
Price action simply refers to the movement of a financial asset’s price over time as displayed on the price charts.
It is usually a visual representation of the supply and demand dynamics of the financial markets and also reflects the collective sentiment of traders and investors toward any financial instruments or commodities.
Why Price Action Leads The News
Price action usually leads the news because it is the most direct and immediate reflection of market sentiment.
Before any event comes up or fundamental news is released, financial traders and investors prefer to use price action to anticipate potential changes in market sentiment and position themselves accordingly.
For example, if the price of a commodity starts to decline rapidly, it may indicate that investors are selling off their positions in anticipation of poor financial results or negative news.
Traders who pay close attention to price action use this as a signal to sell the stock or an instrument in anticipation of further declines, even before the actual news is released.
However, if the price of a currency pair starts to rise, it usually indicates that investors are becoming more optimistic about the prospects of the underlying economy or political situation.
Traders who are monitoring price action use all these criteria as an early indication of a potential trend reversal and position themselves accordingly.
In summary, price action always provides insights into market sentiment and is a leading indicator of future news or events.
As a result, traders and investors use price action analysis as a key tool in their decision-making process, not an indicator-based system or any other form of sentiment
How to Use Price Action to Trade The News
If you want to use price action to trade the news, you need a trading methodology that can help you stay ahead of the curve.
Price action is the best approach for this because it focuses on price movements themselves, rather than relying on external factors to make a trading decision for you.
To be able to use price action to trade the new trends, you need to look out for the following:
The Market Direction (Trending Market):
To be able to stay ahead of the news, you need to be very sound with price action.
And to be right 8 out of 10x, you need to trade in the direction of the trend.
The goes by popular saying, “The trend is your friend.”
By trading in line with the trend, you can better anticipate potential market movements and increase the likelihood of being correct.
This means aligning your trades with the flow of the market structure.
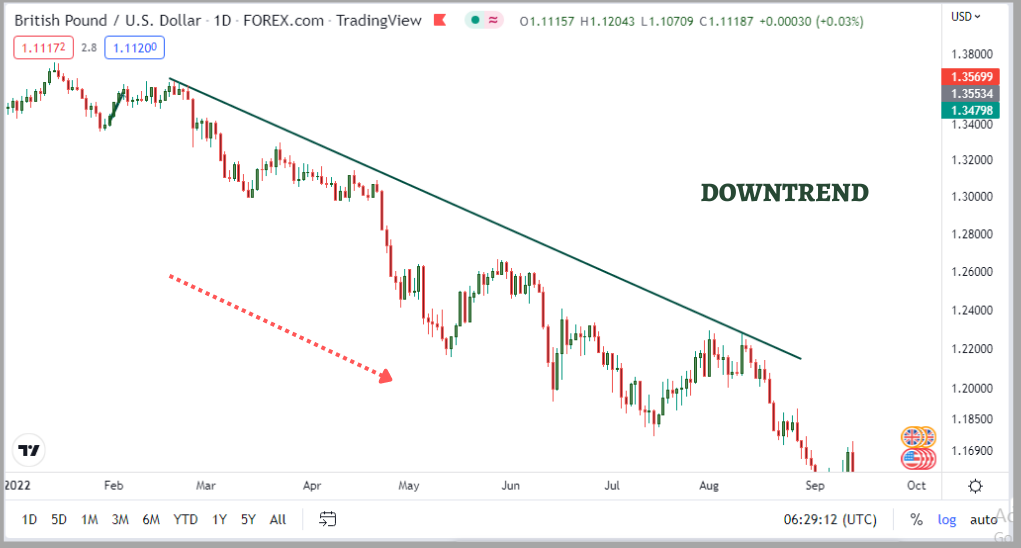
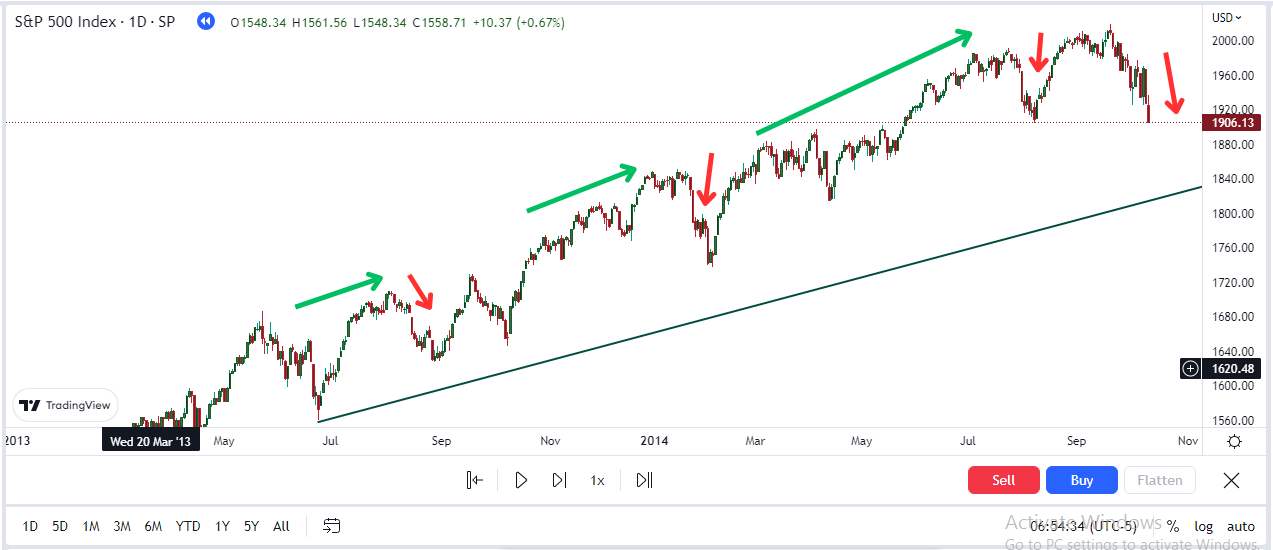
For example, if you observe higher highs and higher lows in the price action, you can identify an uptrend and focus on buying opportunities.
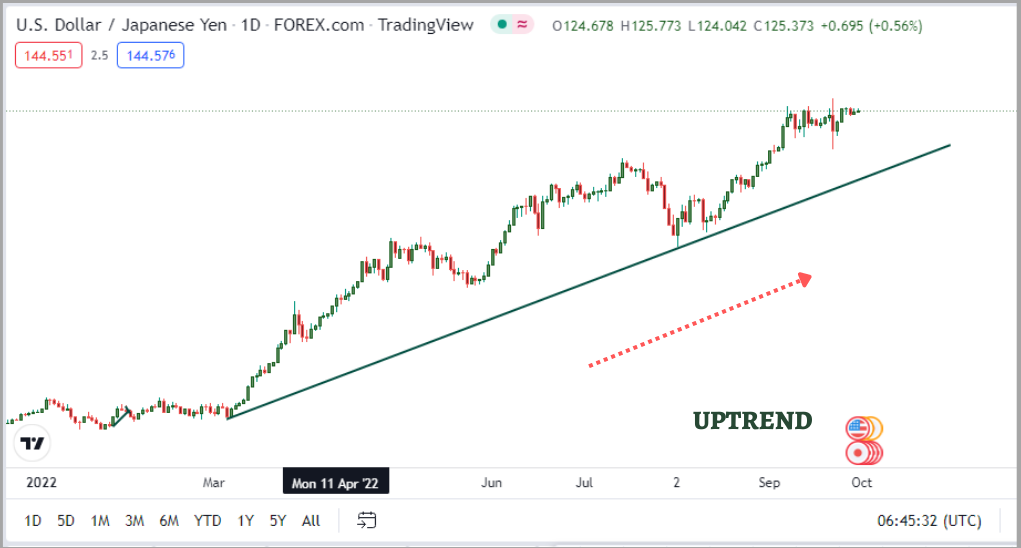
Conversely, if you see lower highs and lower lows, you can identify a downtrend and focus on potential selling opportunities.
By following the trend, you can make more informed trading decisions and increase your chances of success and not getting swept by the news…
Plot Your Support & Resistance Key Levels:
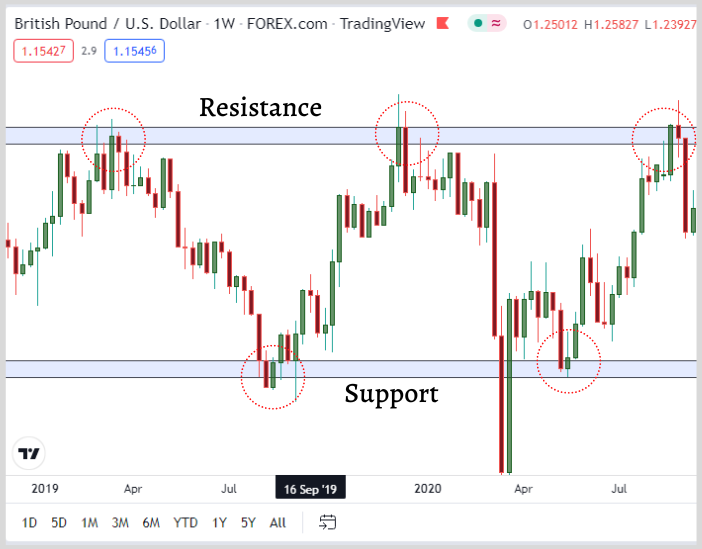
Support and resistance levels are the most important step and the very first step to take before conducting any analysis.
That is because it helps you identify potential zones where the price may likely react.
These zones can help you form an obstacle to the price in the future.
For instance, the price of AUDUSD couldn’t break the resistance level, showing an indication that the price has been rejecting this resistance level.
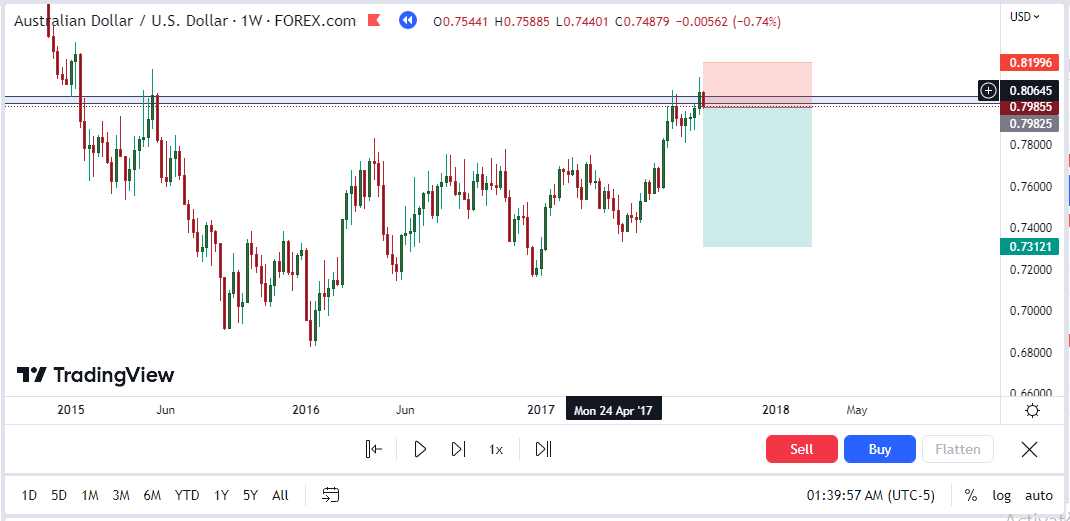
If you placed a sell order around that region, you would have been in profit.
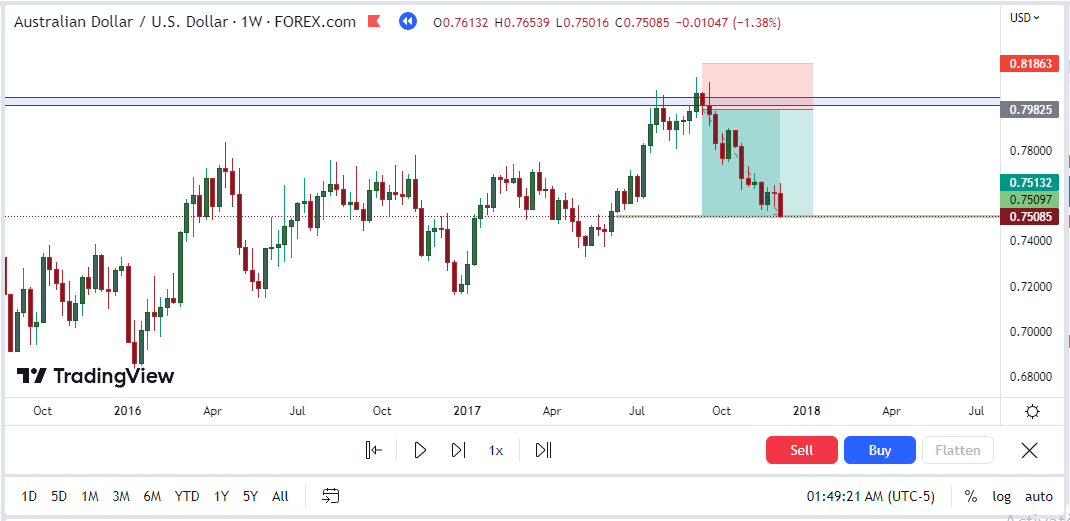
This usually happens only when the price reacts at a certain level, so the price was unable to break through these levels.
So, as a trader, you should always look out for levels and use these signals to make a well-informed trading decision.
Learn More: How I Plot My Support & Resistance Levels
Multiple time frame analysis:
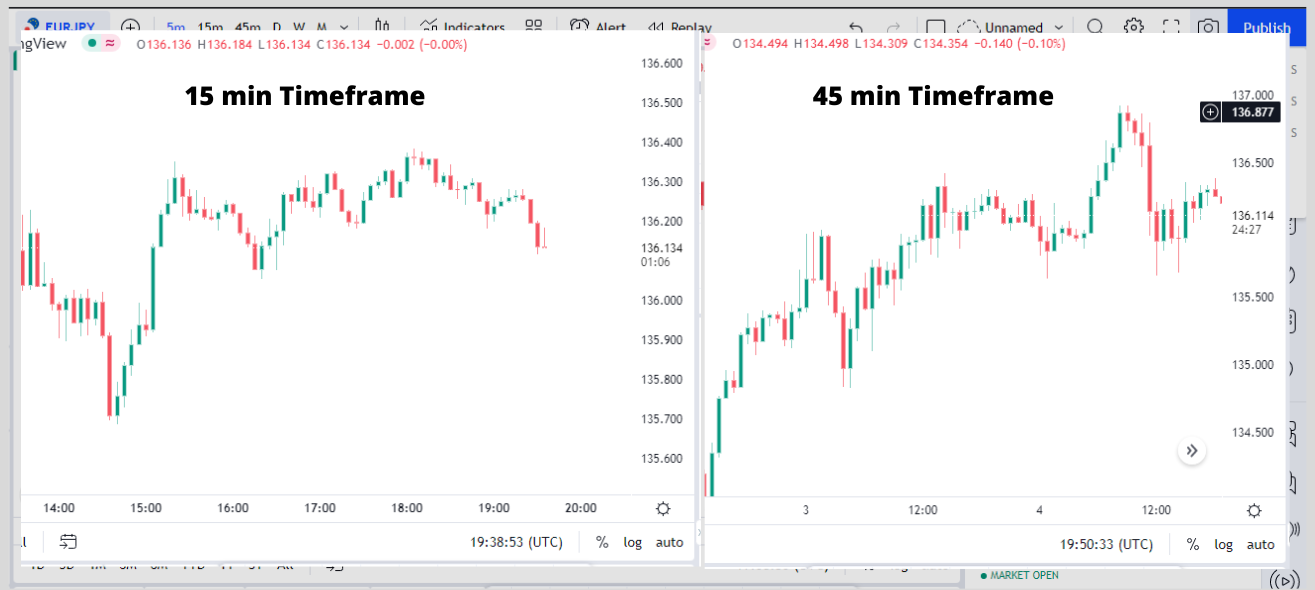
Multiple time frame analysis simply means the analysis of the trend of the market from different time frames.
The purpose of this multiple-time frame analysis is to get a more complete picture of the market’s structure and behavior and to identify potential trading opportunities with greater accuracy.
As a trader, you need to look at a longer-term weekly and monthly chart to identify the overall trend of any currency instrument, and then switch to a lower time frame, like the 4hr and hourly chart to identify potential entry and exit points based on the direction of the higher time frame.
By analyzing the same financial instrument across multiple timeframes, you can get a more comprehensive view of the market’s behavior and make more informed trading decisions.
But from a technical standpoint, the higher time frame paints the bigger picture.
As a trader, you would want to make the higher time frame your best friend because they control what happens on lower time frames.
If the monthly and weekly timeframes indicate an uptrend, then it is in your best interest to look for buying opportunities on lower timeframes and execute.
If at any point, the lower timeframes are not in confluence with the bigger timeframes, then you need to stay out of the markets because it is only a matter of time before the market moves 80% based on the bigger timeframes.
Pay Attention To Price Action Patterns:
Price action patterns such as head and shoulders, double top formations, and various candlestick patterns are significant indicators in the market.
These patterns can provide valuable insights into market behavior and help traders identify potential trading opportunities.
For example, a head and shoulders pattern may indicate a trend reversal from bullish to bearish.
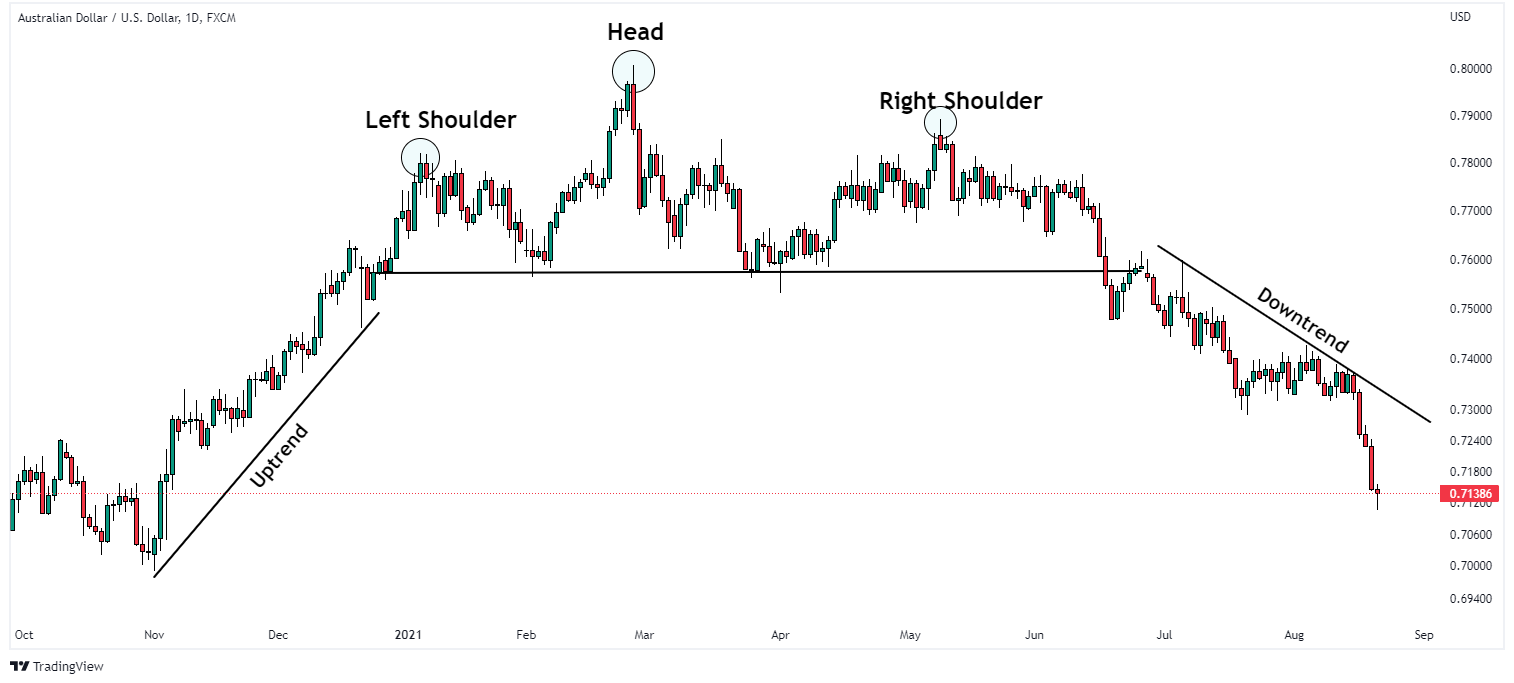
while a double top formation may signal a potential resistance level.
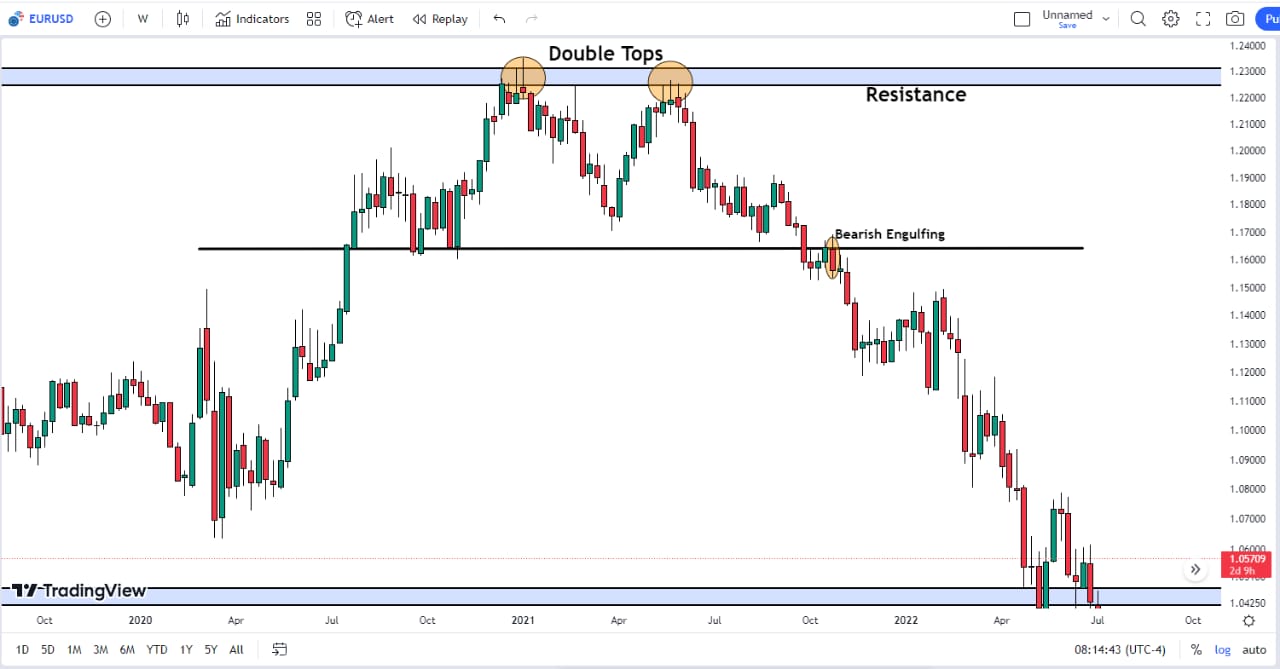
As a trader, these are patterns you should always look out for on Higher timeframes because the longer it takes to form on the bigger timeframe, the more significant it is.
So when you see a head and shoulder pattern form on higher timeframes, then you know trend reversal is about to happen, and then you go on lower timeframes and look for potential selling opportunities.
The Case Study Of The S&P 500 During Brexit Fall
I was in my living room with my mom when I caught a news report indicating that the S&P 500 index was about to encounter significant downward price swings and volatility.
The reason was due to the Brexit referendum, the s&p index (indicating all the top 500 companies in the United States) had been trending upward as investors assumed that the UK would vote to stay in the European Union.
However, when the results were released, it was evident that the UK would indeed be leaving the European Union.
The s&p 500 index experienced a sudden drop in value, declining by over 5% in just 2 days after the results.
Various factors contributed to this sudden drop, including concerns about the economic impact of Brexit, uncertainties surrounding global trade and investment, and worries about potential political instability in Europe.
Despite the negative implications of this news, the charts actually showed a different story, as previously noted.
Despite the impact and gravity of how intense the news was, I was expecting a massive fall in the s&p index.
But from the technical standpoint, we were just simply retracing on the charts.
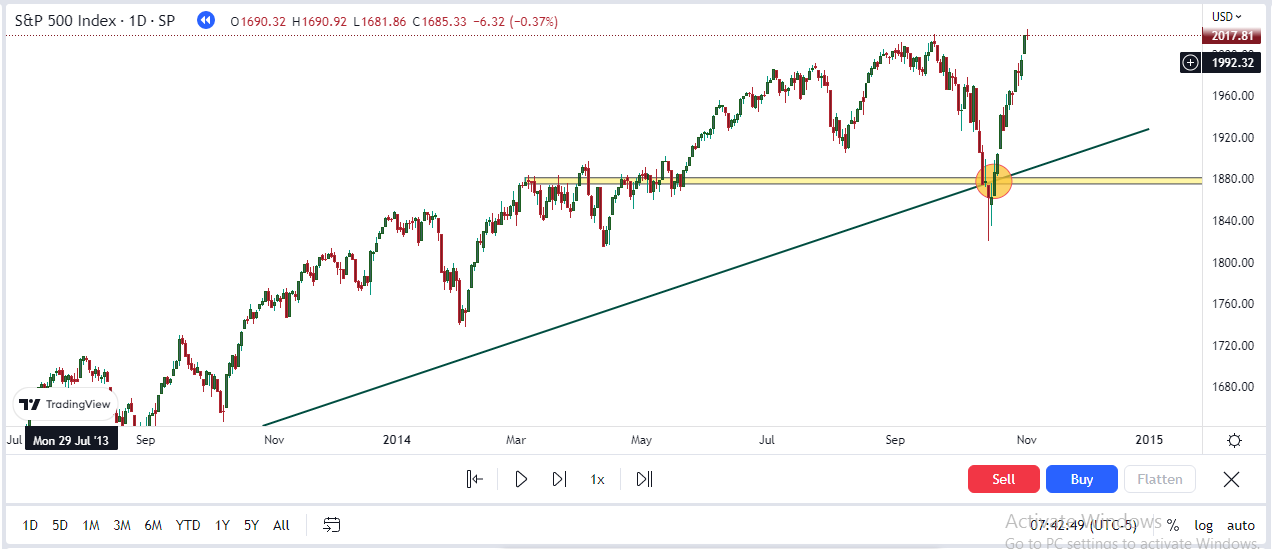
So I did my analysis, and it all came to a confluence region on the Fibonacci 50% and 60% retracements level,s which are the most significant regions.
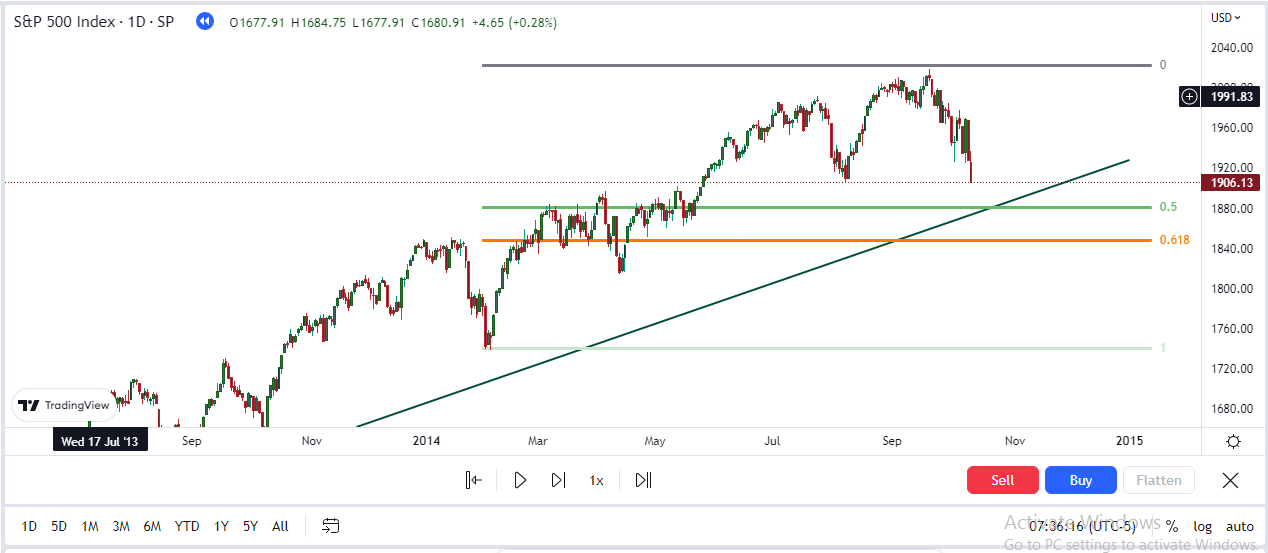
So I placed my buy order around this region, and the market came to trigger my buy order and rallied for 900 pips to the upside.
Now It’s Your Turn.
What insights did you gain from today’s post?
Have you personally had success trading the news, or do you know of any traders who have found profitability through this strategy? Please share your thoughts in the comments.