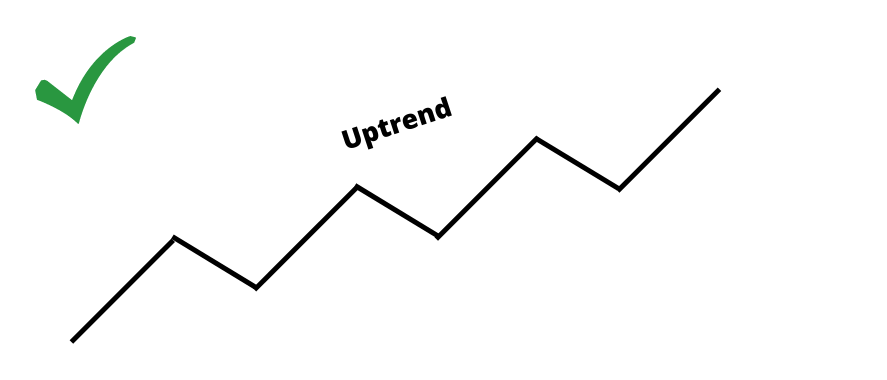
When the market is on a trend for a longer period, it either forms a higher-high, higher-low, or Lower-high, lower-low.
With that, you would be eager to hop into a trade in the direction of the trending market, right?
Of course not! And that’s because the trend is your friend.
But you need a strategic way to get your perfect entry point into the market.
It can be a retest to minor support or resistance level. So you can get a better entry and ride along with the trend.
The pullback is the trading technique that helps you as a trader to do precisely this.
It helps traders hop into trades strategically, so as not to miss out on the trending market.
In this article, you would be learning;
- How pullbacks can help you get a perfect entry point in the market
- Types.
- How to trade using pullbacks.
- Difference between pullbacks, retracements, and reversals.
Let’s dive right in.
What Is The Meaning Of Pullback?
Pullback refers to a temporary pause or halts in the market.
It means, that when a currency is trending impulsively, a temporary pause or halt in the overall direction of the market means a pullback has occurred.
The question now is “What causes pullbacks?”
“How and Why do they occur in the financial market?”
That leads us to
Price Action Setups Behind Pullbacks Effects.
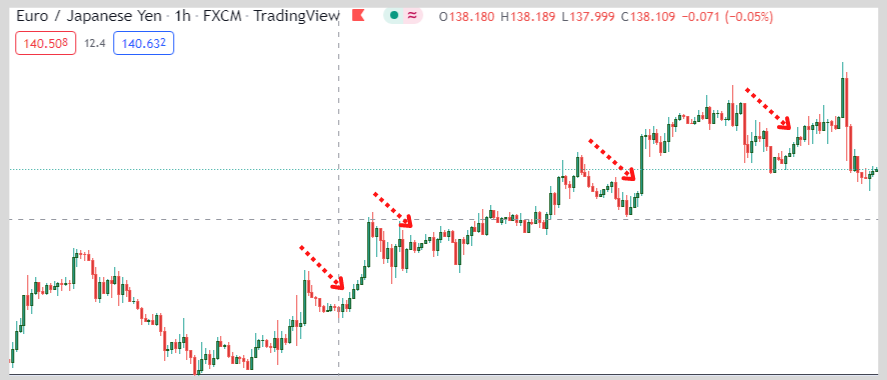
Here is what usually happens, When the market is impulsively trending upwards (Higher-high, higher-low).
Most traders and institutions have a profit target in their minds which is often common.
Let’s take a bullish scenario as an example.
When these traders or institutions take out their profit at specific levels, the strength of the bulls begins to decline and the sellers would have an edge, temporarily.
This action of the bulls in the market causes the price to change its direction temporarily.
Thus, creating opportunities for buyers to hop into trades while trading in accordance with the overall trend.
The next question now is.
How can you use that as an advantage to get a perfect entry point in forex?
And that leads us to the next section,
How To Identify Pullbacks
Let’s face it, Identifying pullbacks can be easy as ABC.
And that’s because the market doesn’t just move in this uptrend manner.
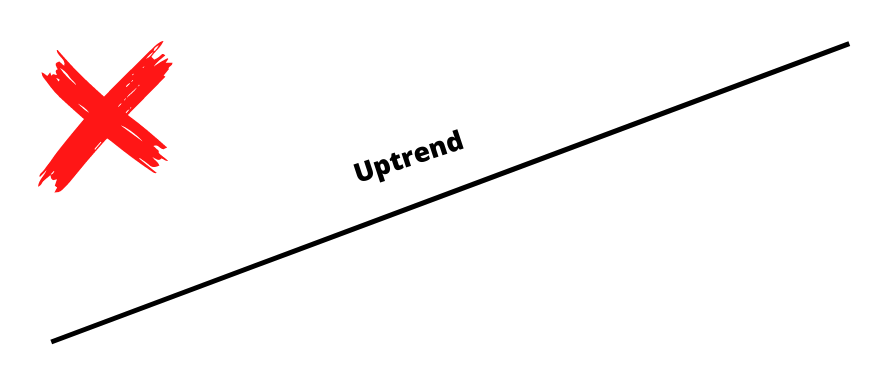
Instead, it makes a temporary pause or change in direction of the market.
And that’s the Good part.
The other side is, how do you spot them out before it happens?
First
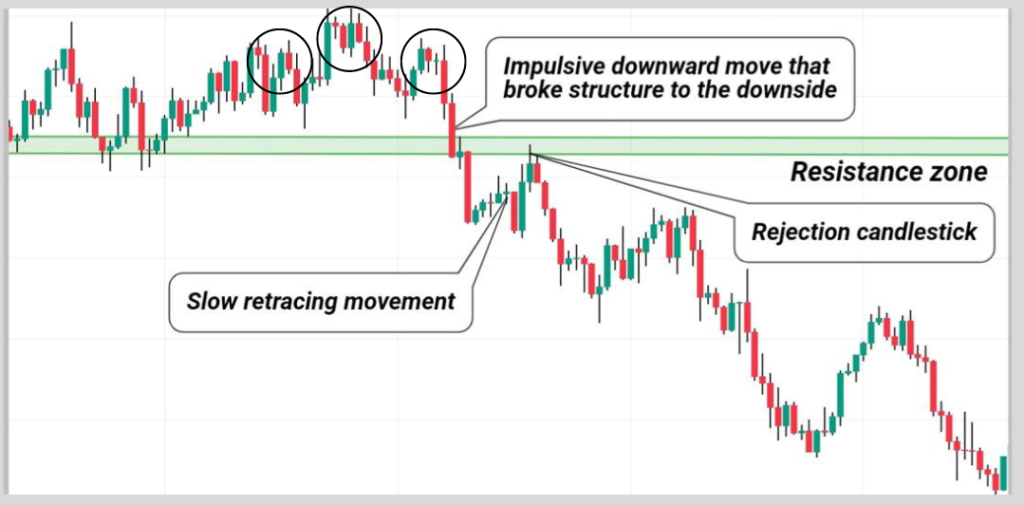
- Identify a strong impulsive move, either upwards or downwards
- Look left to the most recent support or resistance zone
- When the price is returning to your identified zone, make sure that the price is coming back slowly to that zone
- At that zone, be sure to see a rejection or reversal candlestick such as a hammer or engulfing candles.
There you have it, as simple as that!
Types of Pullbacks
Now we know what pullbacks are and how to identify them on the charts.
But we don’t know how often they occur
And that is because pullback formation varies depending on the market condition.
And I will be covering all of that in no time.
To be honest, there are quite a lot.
But most of all, I’ll be covering only (4). why?
They are the most prominent pullback setups I look out for that provide me with a 90% win rate.
#1 Breakout Pullbacks:
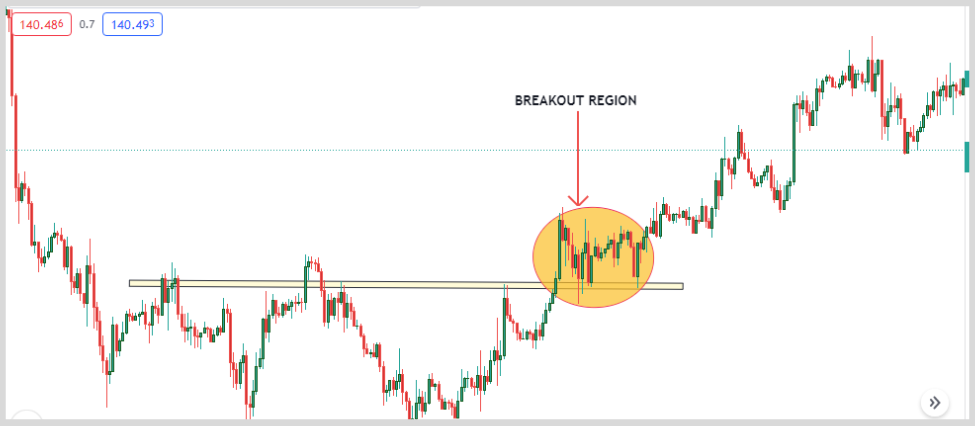
This is one of the most popular types of pullback traders use.
It occurs whenever the market wants to change its overall direction at the support or resistance level.
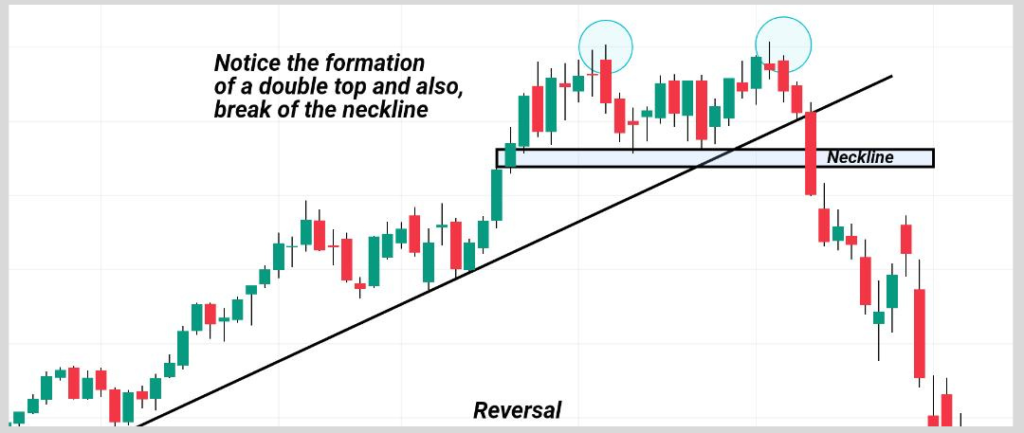
You would want to watch out for breakout pullbacks where price forms reversal patterns such as Head and Shoulders, Double Tops, and so on.
How about we take a look at the scenario below?
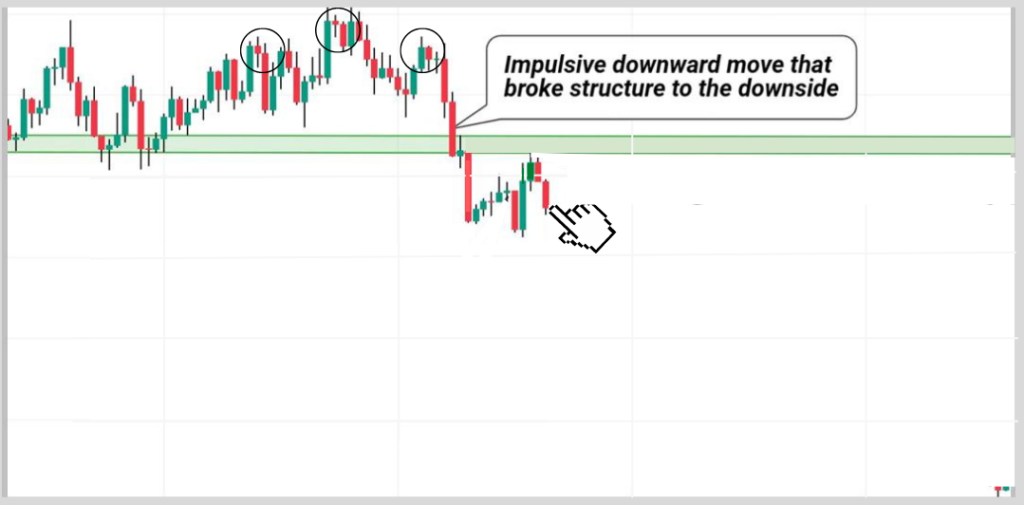
In the above scenario, You would notice that the price had already formed a Head and shoulder pattern and then broke out below the previously sustained support.
Now the question is, “Do I go short whenever this happens?”
This leads us to.
How To Trade Breakout Pullbacks:
Here are 6 simple steps for you to follow.
First, Identify a change in the overall trend of the market, using reversal price patterns such as Head And Shoulders, Double Tops, Triple Tops, etc.
Ensure the price has broken below the neckline of the pattern formed.
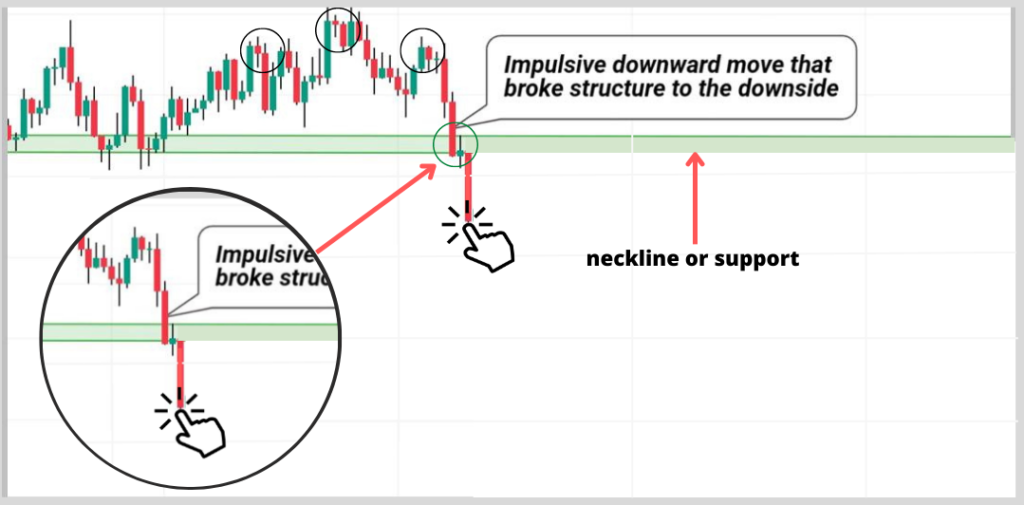
Wait for the price to come back to retest the neckline/support level.
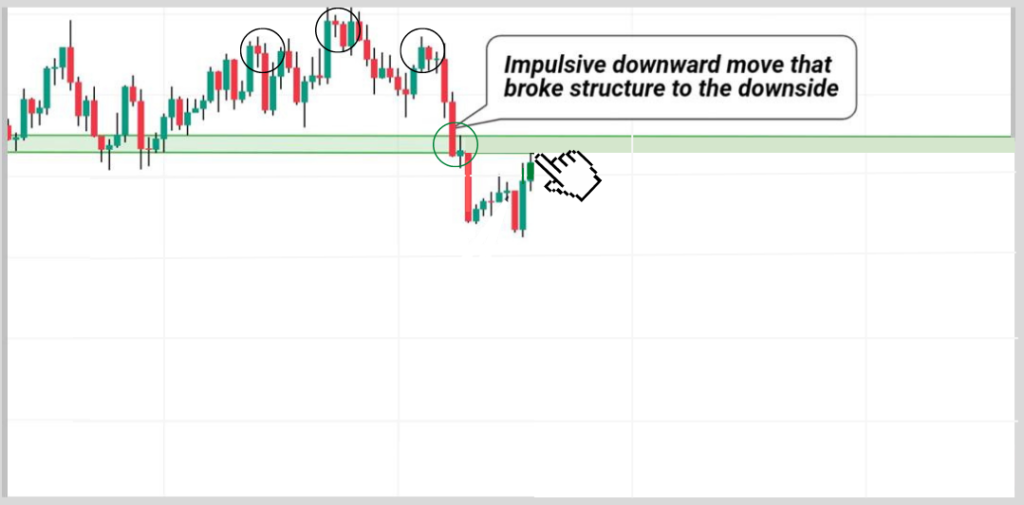
Now at the neckline, Make sure you see rejection or a complete reversal candlestick patterns formation such as a hammer or engulfing.
After a close of the candle, you can then place your trade.
Stop loss should be above the support level.
Or you go in a timeframe lower to find a more clear entry.
NICE!
#2 Trendline Pullbacks:
Trendlines are not uncommon among traders.
They are one of the most reliable and popular trading approaches to the market.
But when it comes to spotting trendline pullbacks, it’s relatively easy.
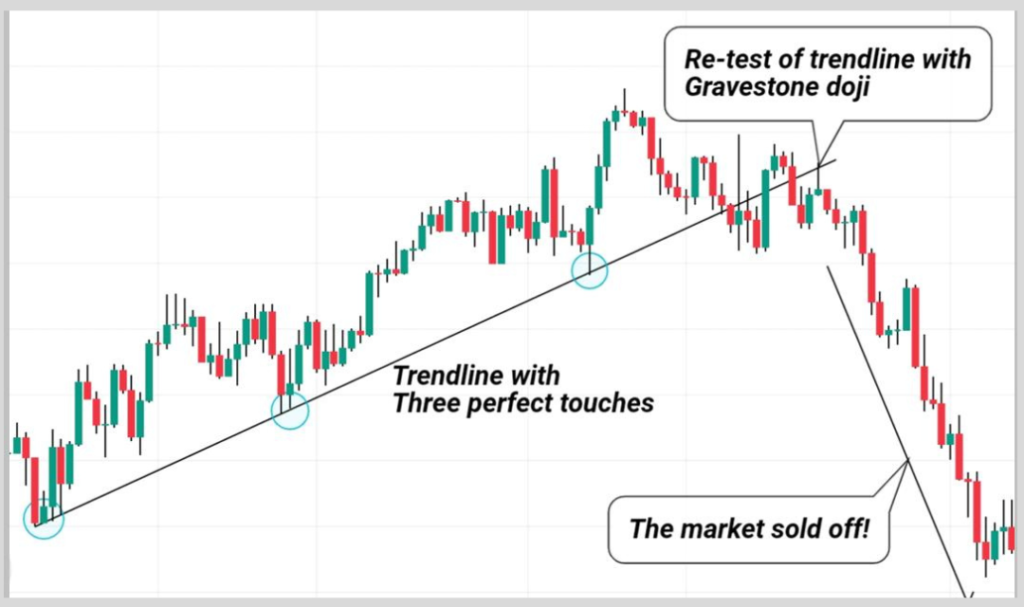
It usually occurs when the price made 3 touches on a trendline and a breakout occurs, and the pullbacks follow.
As shown, a bullish trend.
The question now is,
“Do I then take my trade immediately price has made three successful touches?”
The answer is No! and That’s why you would learn.
How To Trade Trendlines Pullbacks using these 5 steps
Draw your trendline, ensuring at least three perfect touches
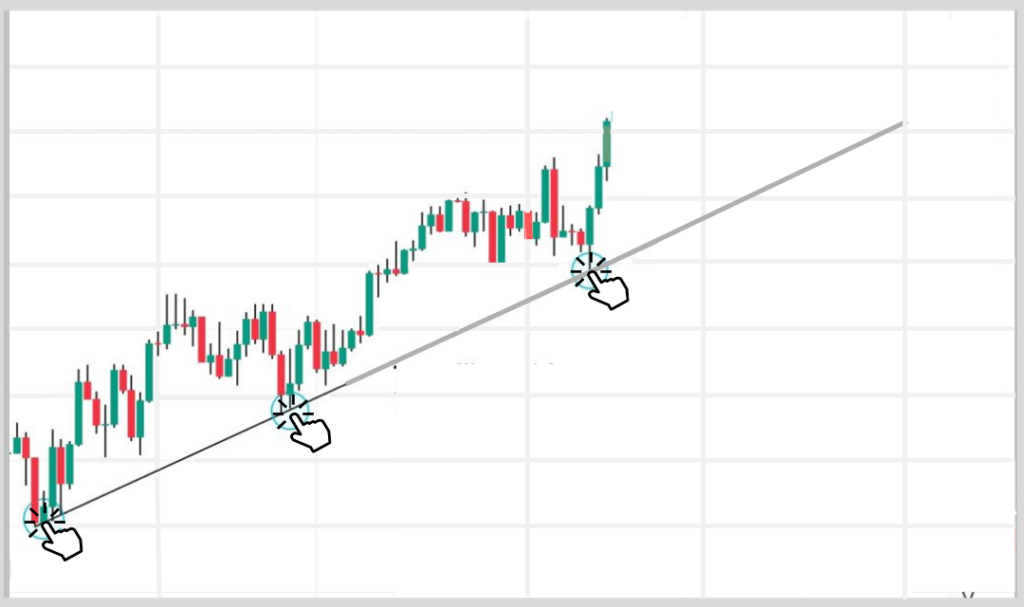
Wait for the trendline break.
Also, the price must come back to retest that trendline
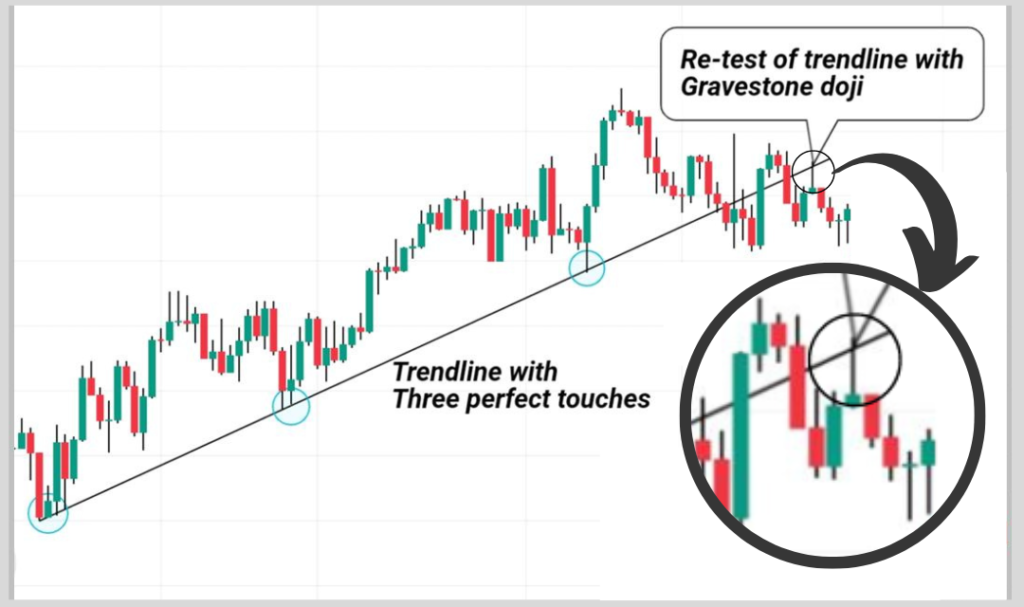
Take to the cognizance of how to price returns to the trendline
Place your trade when the price forms reversal patterns.
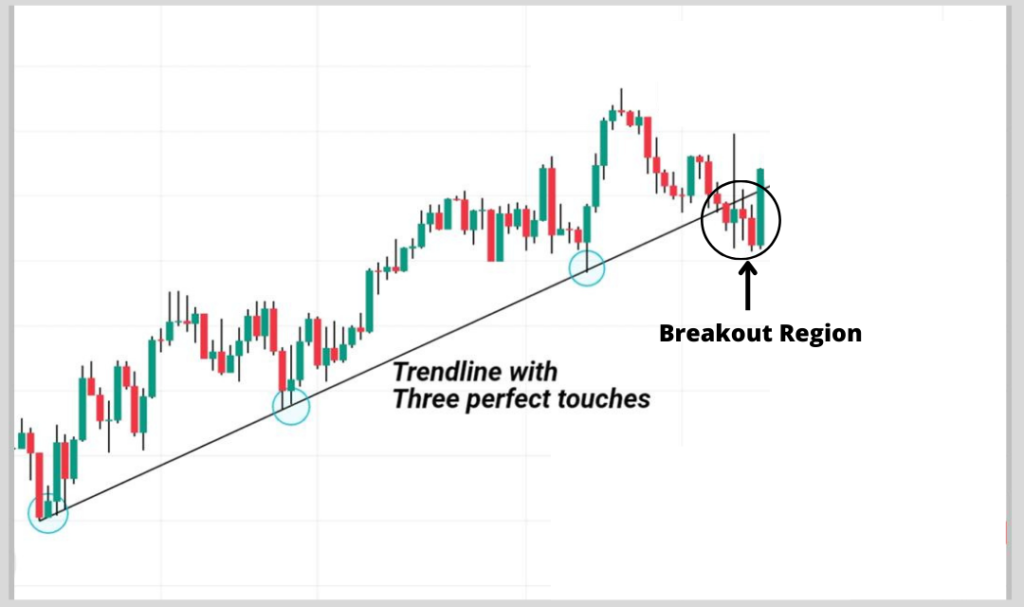
Here is a typical example;
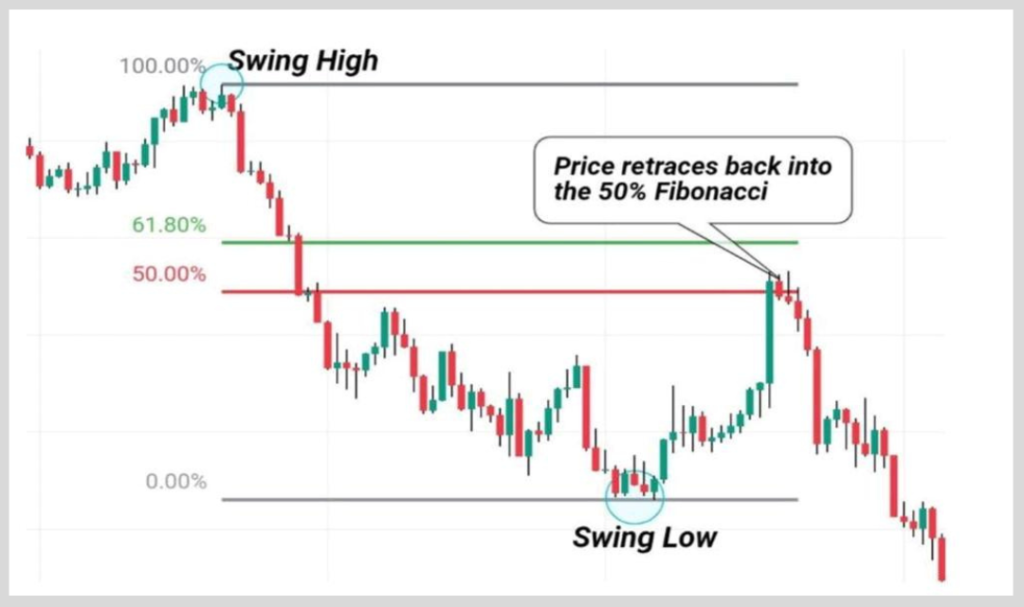
#4 Pullback with Fibonacci:
One of the best tools for confirmation of pullback in technical analysis is the Fibonacci Retracement.
It has proven to be a very reliable tool for anticipating where prices could potentially react from.
How To Trade Pullbacks With Fibonacci
The following are 5 simple steps you should follow when using Fibonacci with pullbacks
- Identify an impulsive trend in the market
- Identify obvious swing high and swing low
- Draw your Fibonacci from swing high to swing low ( in the case of a downtrend ) or from swing low to swing high ( in the case of an uptrend )
- Make sure that the price retraces back to at least 50% of the Fibonacci.
- Then place your trade.
Here is a perfect example
You’ve made it up to this level.
Now it’s time for us to make comparisons.
Pullback vs Retracement vs Reversals
The above terms, however similar they might be but are different from each other.
Curious, right? Let’s find out.
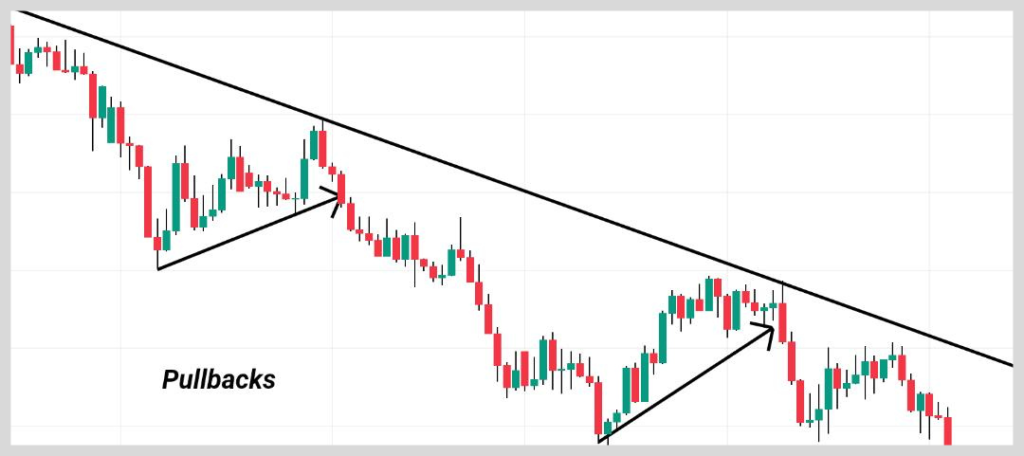
You must have been very well acquainted with pullbacks by now.
Once again, here is how it looks.
So, let’s move on to the other terms.
Retracement
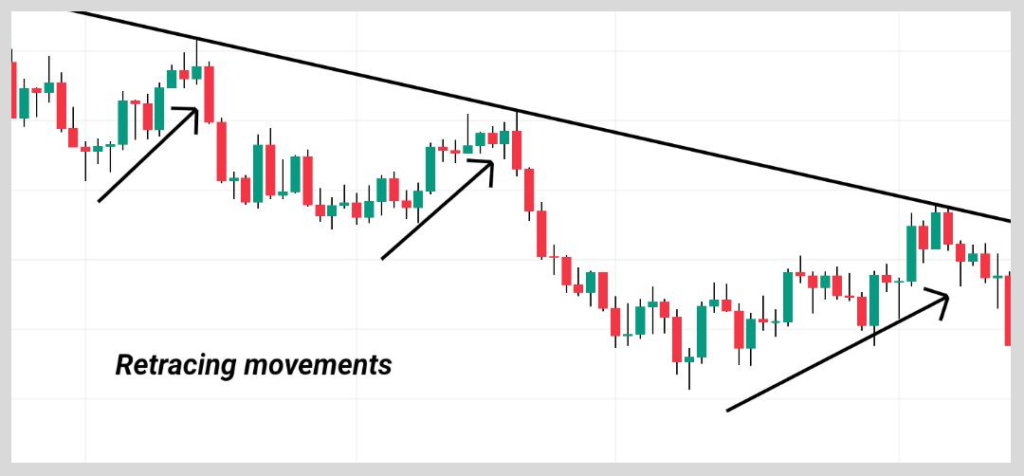
Retracements are also temporary changes in the price overall trend but it minor than the pullbacks.
You should be aware that while pullbacks take a couple of candlesticks to complete their change in direction, retracements involve more candlesticks than that pullbacks.
Retracements are similar to pullbacks.
Reversals
Reversal is the complete change in the overall direction of the market.
For instance,
When the price continues to make higher highs and higher lows, it signifies an uptrend, right?
But when you notice that the price has broken below the previous low, with a full body candle close or with a reversal price pattern, the price is telling you that it wants to change its direction.
Hence, showing a possible reversal in the overall trend.
Note: Some pullback might indicate the beginning of a new trend.
That said.
You should, therefore, place your stop-loss at the point where you would be convinced that the price would reverse completely.
And that’s about it for reversals, retracement, and pullbacks.
Frequently Asked Questions (FAQs)
Can I Trade Pullbacks With Support And Resistance?
Of course, you can! Support and Resistance are the backbones of all strategies.
A combination of both would increase the profitability of you having successful trades.
What is the best tool for trading pullbacks?
I don’t use indicators, but I have passed through the stage.
That said, I would advise that you combine Fibonacci pullbacks with any other strategy.
The two work best together.
How do I know where pullbacks could potentially react from?
Easy, you can use Support and Resistance or the Fibonacci Retracement tool.
They have a high profitability rate.
What is the best timeframe to use when trading pullbacks?
As I always recommend, Do your top-down analysis from the higher timeframe and then scale down to the lower timeframe for entries.
That said. It is best you identify pullbacks on the 4-hour timeframe minimum.
Conclusion
I hope I have been able to broaden your knowledge about pullbacks and also, show you how to trade using pullbacks.
Note that reading alone isn’t enough, you have to practice so as to get used to seeing them in your charts.
I hope you enjoyed this article, if so subscribe so as to stay updated.
Also, if you have any questions, comment down below and let me know your worry.
That said. I wish you good luck as you journey in your trading career.