In the trading world.
Understanding the term ‘market structure‘ is of great importance because, without it, there would be no basis on which trading decisions would be made.
It is necessary for you as a trader to understand what market structure means to know the right approach to the market when taking trading decisions.
With market structure.
You get to understand price movements and how to use this interpretation to make the most out of the market is the creation behind this post.
That said.
So In today’s post:
- You are going to understand all you need to know about market structure
- Its various types
- How to determine them
- Best timeframe to use with it, and so much more.
That said!
Let’s dive right in.
Key Takeaways
- Swing Points are key levels in price movements that form either highs or lows, which are known as swing highs and swing lows.
- Top-down analysis involves analyzing the market starting from the higher timeframes (like monthly or weekly charts) to understand the overall trend and key levels, and then moving down to lower timeframes (like 4-hour or 1-hour charts) to fine-tune entries and exits.
- Continuation Patterns indicate a temporary pause in an existing trend, after which the trend is likely to continue.
- Reversal Patterns signal a change in the existing trend direction.
- Breakout Patterns occur when the price breaks through support or resistance levels, indicating strong market moves.
What is Market Structure?
Market structure or price action simply means price movement.
It is the way price moves in a trending (bullish or bearish) or consolidating manner.
It is basically:
- Support and resistance zones
- Swing highs and swing lows in the market
- These are usually key levels where every trader wants to get into trades.
The Good part: everyone is looking for their different confirmations to either buy or sell at support or resistance levels.
While on the other end,
Others might be looking out for pullback or retracements into a particular Fibonacci level to either buy or sell, in continuation of the trend.
That’s just about it for the definition of marketing structure.
Moving on
Types of Market Structure.
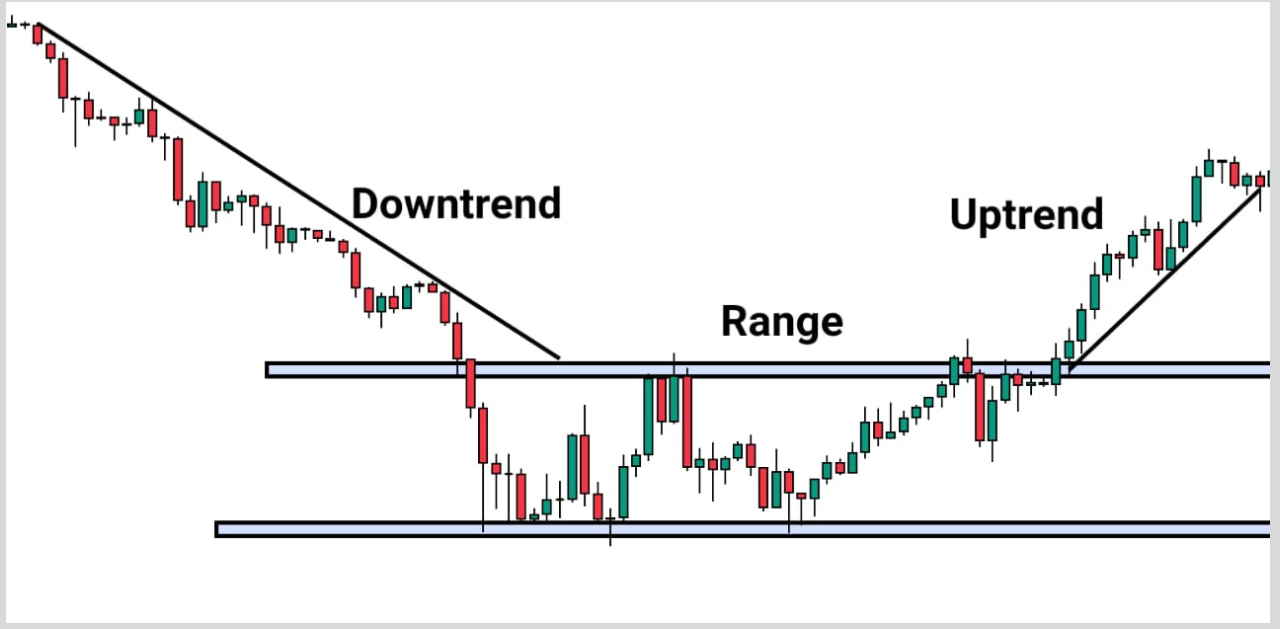
The birth of the three types of market structure is because the market moves in three different types of ways, which are;
- Bullish Trend
- Bearish Trend
- Consolidation (range)
Let’s take each one of them and explain:
Bullish Trend
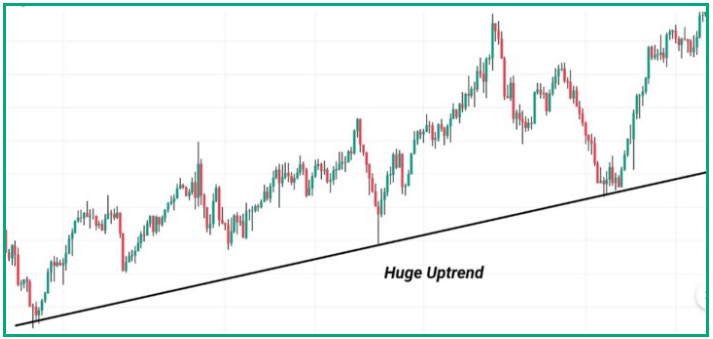
A bullish trend can be seen when the market makes consistent higher highs and higher lows.
These two key criteria, when met, help traders understand that the market is in an uptrend.
It is a period when buyers have taken over the market, with no room for the bears at all.
Everybody is clicking the buy button!!!
The bulls have overcome the bears in the market and have pushed prices higher.
This action of theirs results in the formation of consistently higher highs and higher lows.
Bearish Trend
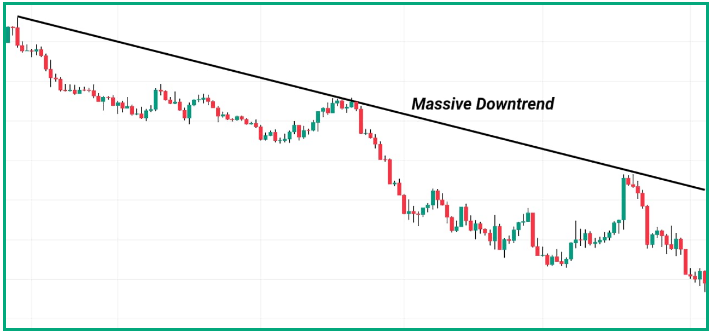
The bearish trend is the direct opposite of the bullish trend.
It is formed when the market consistently forms lower lows and lower highs.
When these two key criteria are met, it indicates that the market is trending downward.
This is a period when the bears take the bulls for a ride down the hill and make no room at all for the bulls.
In essence, they overcome the bulls and push prices lower.
This results in the formation of consistent lower highs and lower lows.
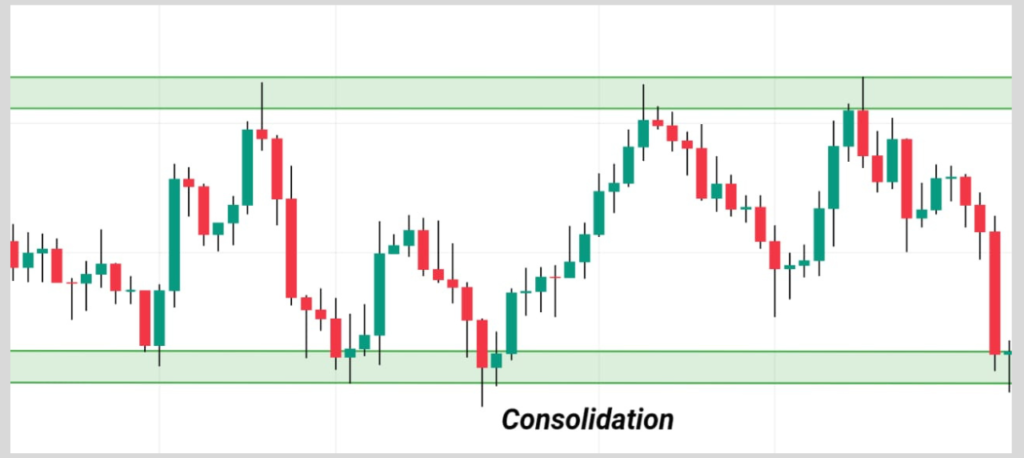
Consolidation
Now, when the bulls and the bears are of equal strength in the market, they form a Consolidation.
Most of the time, traders describe that as a ranging market.
In this case, no one is overpowering the other.
This is not a trending phase because the market doesn’t show clearly what direction it wants to potentially head.
Price just keeps moving within a range.
Most traders usually get stopped when trading in a ranging market, and they claim the market is rigged.
And then you have all three together.
That’s it about the types of market structure.
The possible questions now are,
- How do I then identify market structure?
- How do I know what’s going on in the market?
- What are the key levels?
This leads us to the next section:
How To Identify Market Structure
I have mentioned earlier the characteristics of market structure.
Thus, the identification of the market structure is easy.
Now let’s take a close look at each one of them.
The characteristics of the market structure I mentioned earlier were;
- Support and Resistance.
Also
- Swing Highs, and
Swing Lows.
For you to understand these concepts easily, I would pair them up while explaining.
Support & Resistance
These are two fundamental concepts that every trader needs to know.
Why?
Simple, it’s because they are the backbone of the market structure.
If support and resistance are drawn properly, they help you to understand where and when to enter and exit the market.
Therefore, just as important as it is to know the market structure and its types,
It is also crucial for you to know about support and resistance.
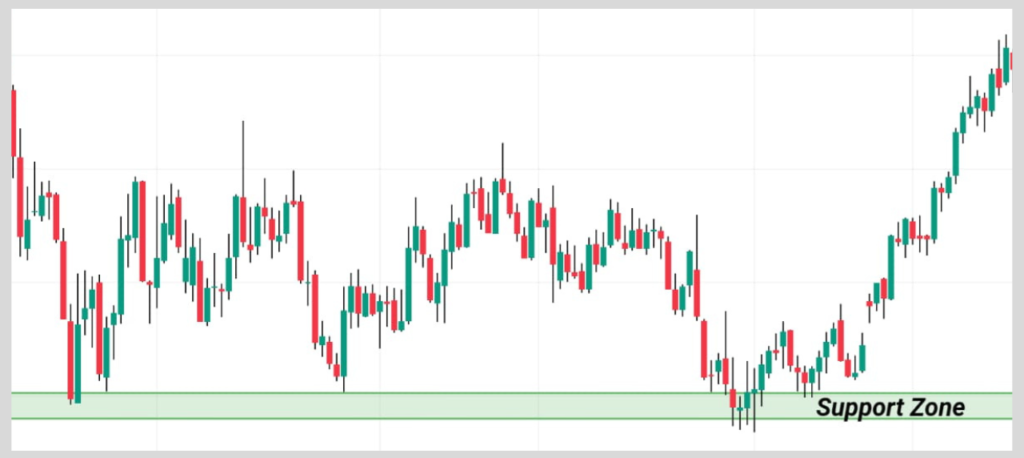
What is support?
Understanding that support is a zone and not a line is one of the key steps to knowing what support is.
That said.
A Support is a zone or level where the price experiences huge buying pressure due to the weakness in selling pressure.
A support zone can also be referred to as a ‘Demand Zone’.
This zone is where every trader would want to start buying since support indicates buying pressure.
Here is an example;
Resistance
Resistance is a zone where the price experiences huge selling pressure as a result of a decrease in the strength of the bulls.
A resistance zone can also be called a ‘Supply Zone’.
This is a zone where traders are looking for selling opportunities.
Here is an example;
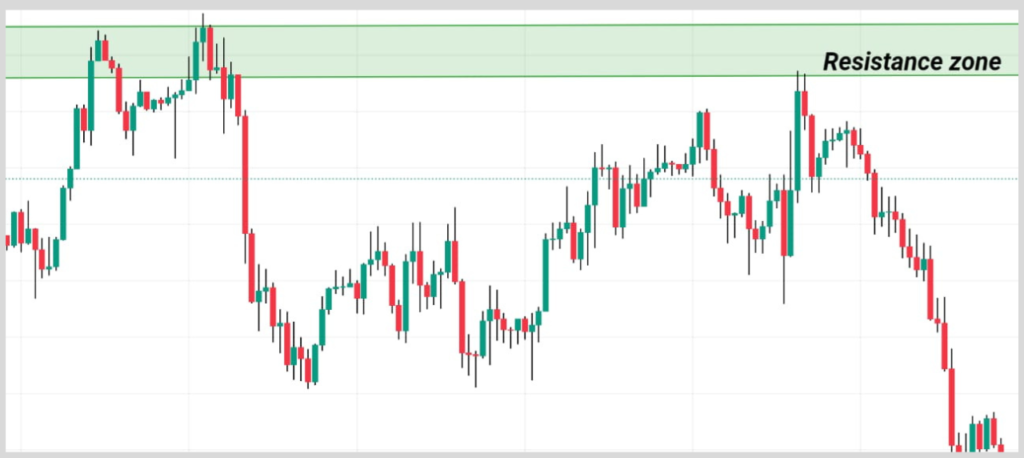
Note: Notice how each zone was drawn using rectangles (zone) and not just a line.
Support & Resistance Types
There are two types of SR
- Horizontal SR
- Dynamic SR
Note: SR means Support and Resistance.
Horizontal SR
Horizontal SR is constant zones that prevent prices from pushing higher or lower.
Dynamic SR
Dynamic SR caused by uptrend and downtrend can be identified by;
• Trendlines, and
• Moving averages.
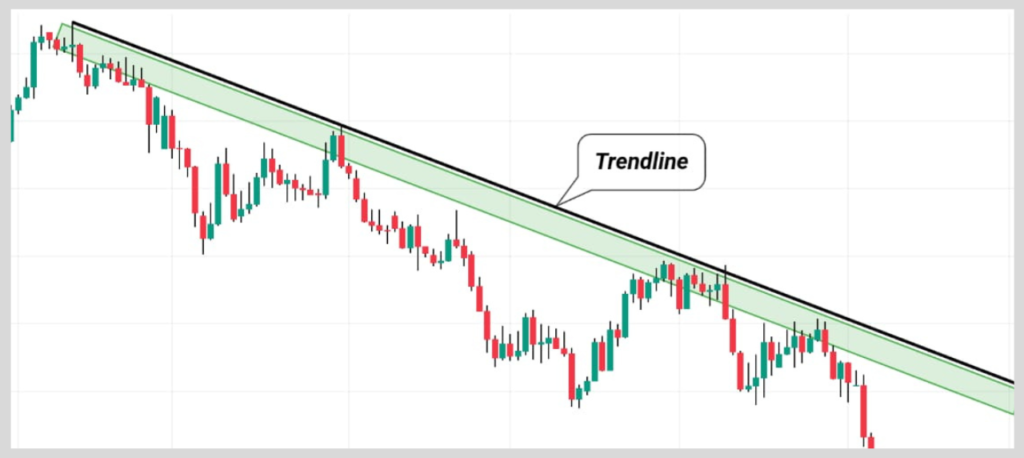
Trendlines
These are sloping lines used to identify Dynamic SR.
Here’s an example;
NOTE:
Remember that support and resistance are zones (not lines), and it applies to both horizontal and dynamic SR.
Moving on, we will discuss;
- Swing high and
- Swing low.
Swing High
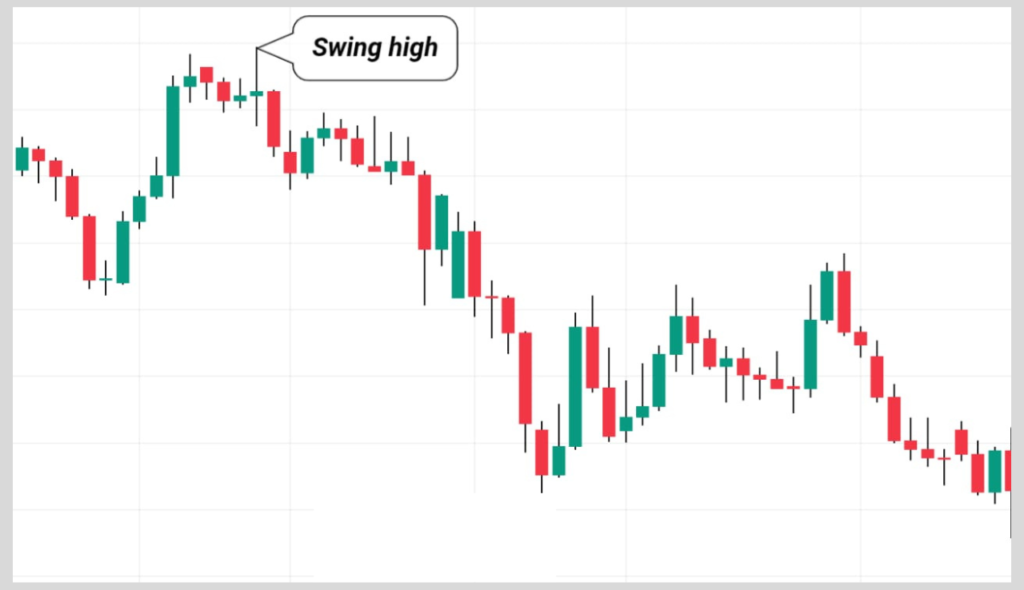
A swing high is formed when a particular high is reached that is greater than all other surrounding highs.
Consecutive formation of swing highs indicates a clear uptrend.
It is also formed in a range-bound market.
Swing highs are used to identify both trending and ranging markets.
It also helps you, as a trader, determine the strength of the price.
Swing Low
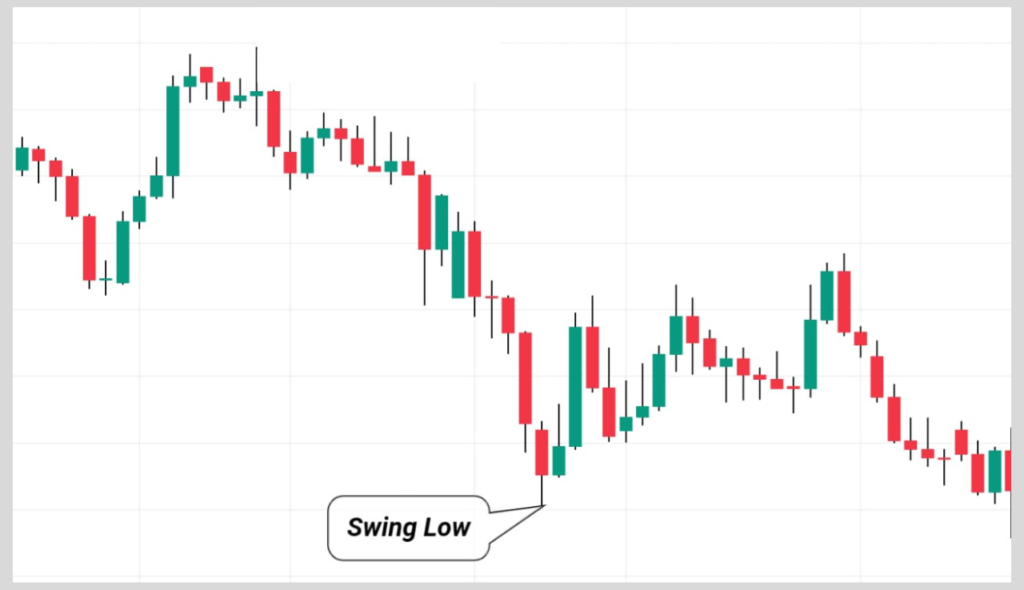
A swing low is formed when a particular low is reached that is lower than all other
surrounding lows.
Also, when a series of swing lows is formed, it indicates that the market is in a clear downtrend.
Swing lows help to determine the overall direction of the market and the strength of the price.
Importance of Support & Resistance and Swing Highs & Swing Lows.
Having discussed at length the Identification of market structure,
it is also crucial for you to understand their importance to use them effectively in your trading.
Support and Resistance help you to identify key levels in the market where the price could potentially react.
They help you know where the market is potentially heading and therefore help you make your trading decisions based on the direction of the market, usually gotten from the higher time frame.
Swing highs and Swing lows are also of great use because they speak volumes about the strength of the buyers and sellers in the market.
They help you know when the market will reverse or when it will continue from its previous trend, and also help traders set their stop losses and take profits.
Forex Market Structure Patterns.
For you to understand what market structure patterns are, you must understand price action and its different types of patterns.
What are Price Action Patterns?
Price action patterns are recurring and recognizable price formations, usually identified by trend lines and/or curves, as the case may be.
It usually signals reversals in price movement, a continuation from its existing movements after a brief pause, or a breakout.
No wonder why it is the most sought-after.
The price patterns commonly talked about are morning stars, engulfing patterns, shooting stars, and so on.
But as you read along, this article will divulge more advanced price patterns that would take your price action trading skill to the next level.
Types of Price Action Patterns.
You will be learning 3 significant types of price action patterns in this section.
- Continuation,
- Reversal, and
- Breakout price action patterns.
Let’s explain each one of them.
Now,
Continuation patterns.
Continuation patterns, which are usually temporary, can be described as an interruption in the overall trend of the market.
Let’s break it down further.
Continuation patterns are price patterns that signal a rest phase, usually occurring after impulsive moves have been made by the price.
It is a phase when the bulls catch their breath after impulsive moves to the upside, when in an uptrend.
And when in a downtrend, it is a period when the bears take a break after impulsive moves to the downside.
So basically, when a price continues from its pre-existing trend, the price patterns are known as continuation patterns.
Continuation patterns that you should take note of are;
- Flags,
- Triangles, and
- Cup and handle.
Okay, let’s continue.
I would explain each one of them.
To begin with,
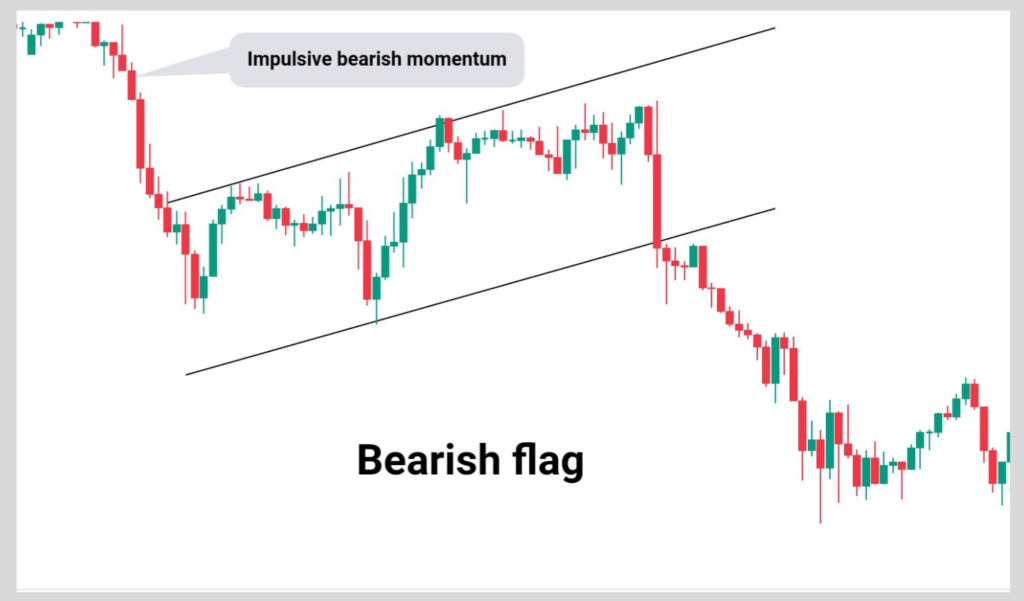
Flags:
Flags are continuation patterns, constructed using two parallel trend lines.
They can be sloppy, either to the upside or downside, or horizontal.
Generally, upward slope flags indicate a pause from an impulsive downtrend,
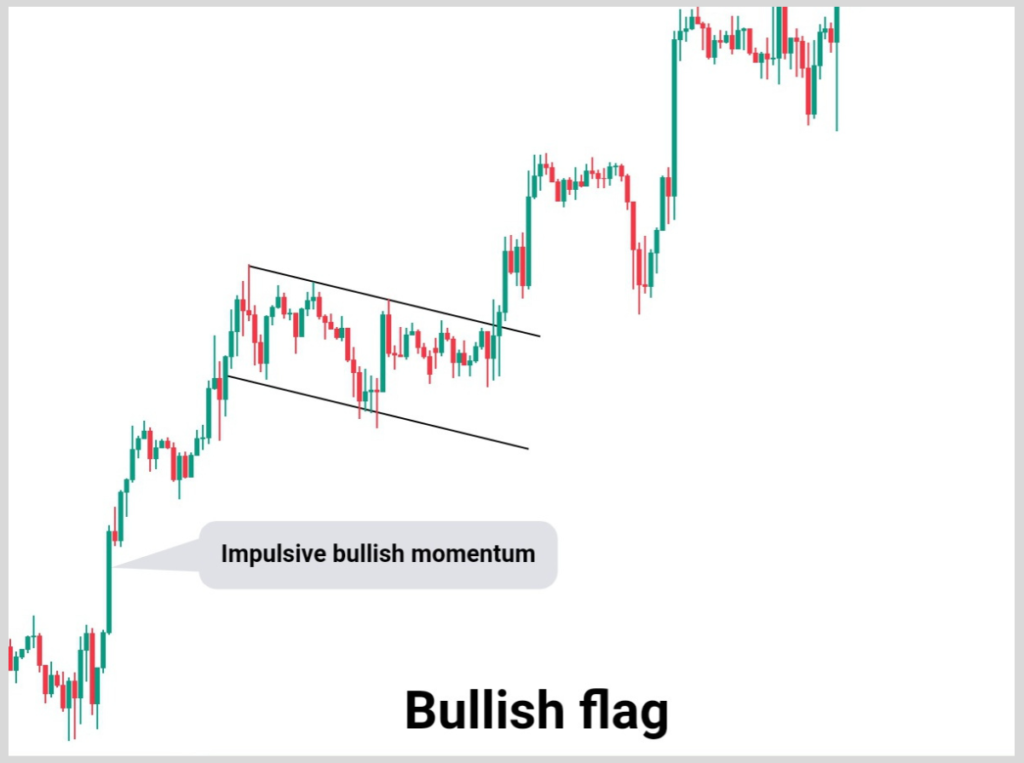
while downward slopes indicate a pause from an impulsive uptrend.
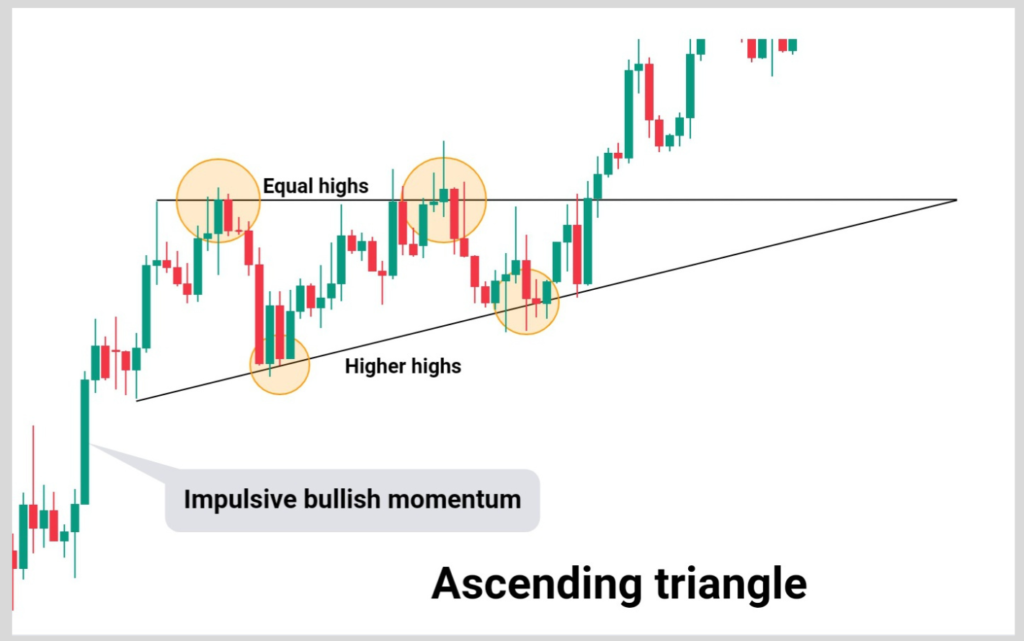
Triangles:
Triangles are one of the most popular price patterns due to their frequent recurrence compared to other patterns.
Continuation pattern.
It is characterized by an impulsive trend move followed by equal or unequal highs and equal or unequal lows.
You might be wondering what I mean by that, but do not fret, I will break it down.
Whenever a price forms an impulsive bullish trend followed by two or more equal highs and a series of higher lows,
It is known as the Ascending triangle pattern.
Conversely,
when price forms an impulsive bearish trend followed by two or more equal lows and a series of lower highs,
It is known as the Descending triangle pattern.
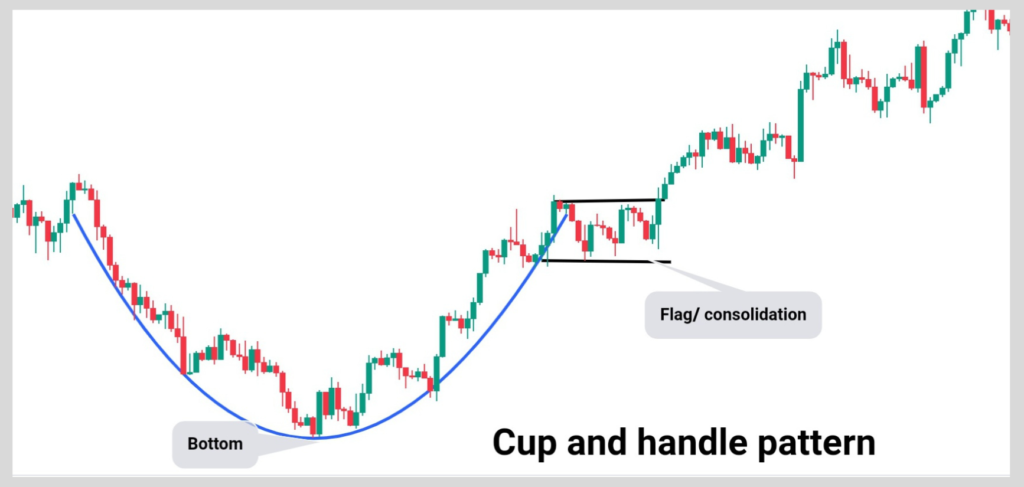
Cup and Handle:
A cup and handle is a bullish continuation pattern that is formed after the rest phase of an uptrend.
The “cup portion” resembles the bottom of a bowl or a “U” shape with equal highs.
The “handle” portion is formed at the right side of the cup, usually in the form of a flag.
On its completion, the price is expected to push upwards and therefore, resume its uptrend.
That’s all about continuation patterns.
Let’s move on to the next.
Reversal patterns.
Reversal patterns are price patterns that indicate a change in the overall pervasive trend.
Reversals are often caused by “take-profits,” which implies that the prevailing bearish or bullish trend,
As the case may be, they would run out of energy to further their sudden movement.
At this time, the price experiences a temporary pause (without a range) and then heads in a new direction.
There are two types of reversals, which are;
Distribution reversal patterns and accumulation reversal patterns.
Distribution reversals usually occur at the top of the market,
where traders anticipate selling as a result of the trading instrument being “overbought”.
While accumulation reversals occur at market bottoms, where buying pressure increases more than selling, due to the trading instrument being “oversold”.
Examples of reversals are,
- Head and Shoulders
- Double tops and double bottoms, and
- Triple tops and triple bottoms, etc.
Head and Shoulders:
As its name implies, Head and Shoulders denotes smaller price movements around a larger one.
Head and Shoulder patterns can either appear at market tops or market bottoms.
Head and shoulders are defined by two swing highs (the shoulders) with a higher high (the head) between them.
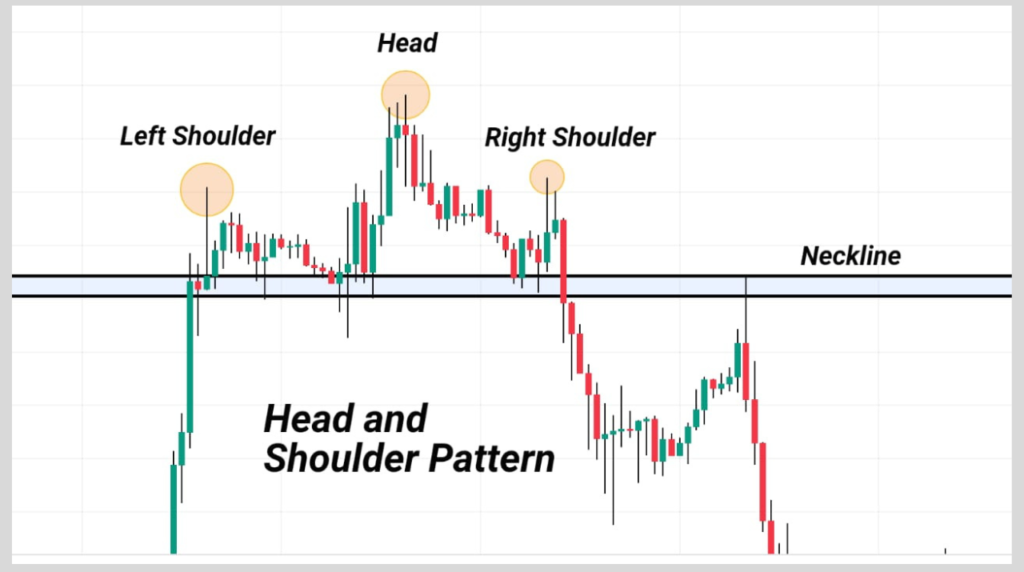
This price action interrupts the prevailing uptrend, appears at market tops, and also signals selling opportunities.
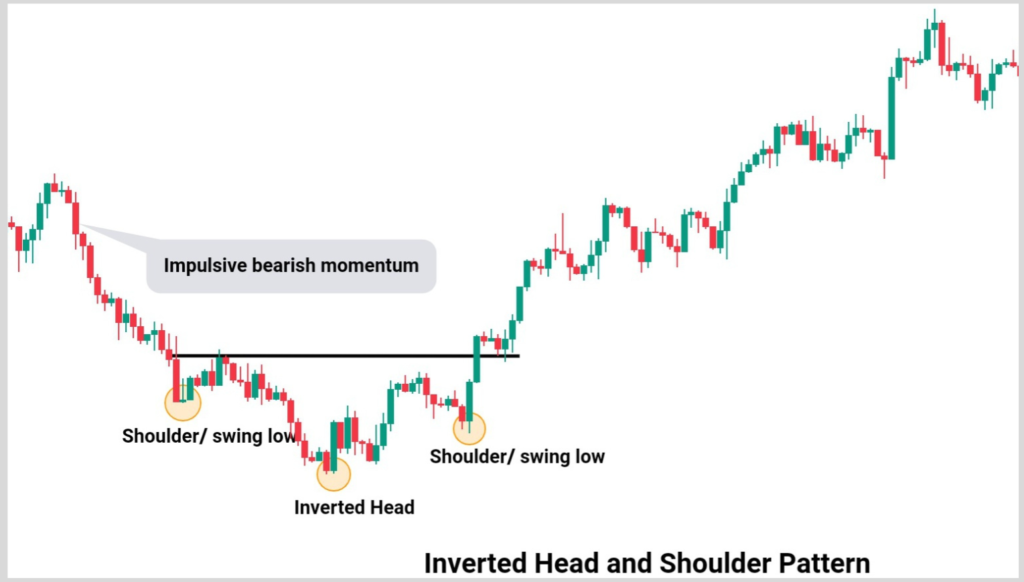
The price action defined by two swing lows with a lower low between them is called an inverted head and shoulders.
It interrupts the prevailing downtrends, appears at market bottoms, and also indicates buying opportunities.
A horizontal or slightly sloped trend line can be drawn connecting the peaks and troughs that appear between the head and shoulders, as shown in the figures below.
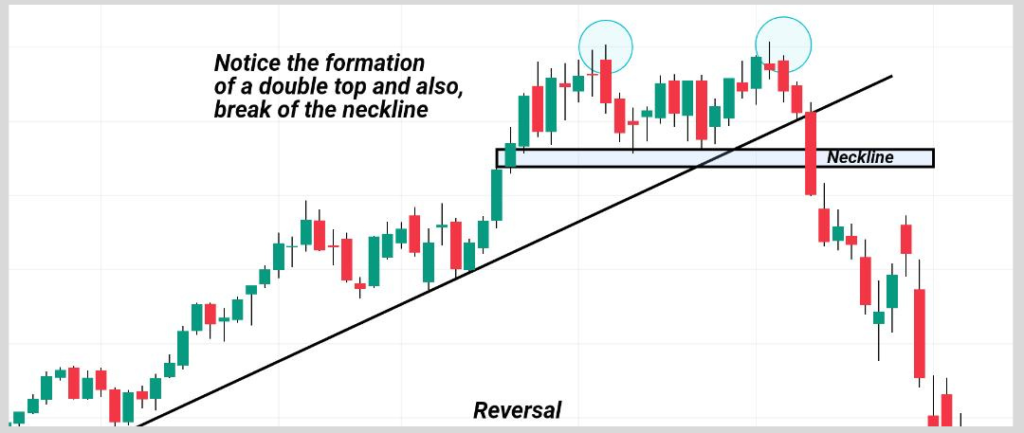
Double Tops and bottoms:
Double tops are strong reversal patterns that appear at market tops.
They occur after prices have made two unsuccessful attempts to break above a resistance zone.
They are usually relatively equal highs, and can also be equal highs.
Double tops are a similarity to the alphabet “M,” and they signal selling opportunities.
Double bottoms are the opposite of double tops in that they are strong reversal patterns that appear at market bottoms.
They occur after the price has made two unsuccessful attempts to break below a support zone, and they signal buy opportunities.
Double bottoms are usually relatively equal lows and can also be equal lows.
They resemble the letter “W“.
Triple Tops and Bottoms:
Triple tops and bottoms are price action patterns that appear at market tops and bottoms, respectively.
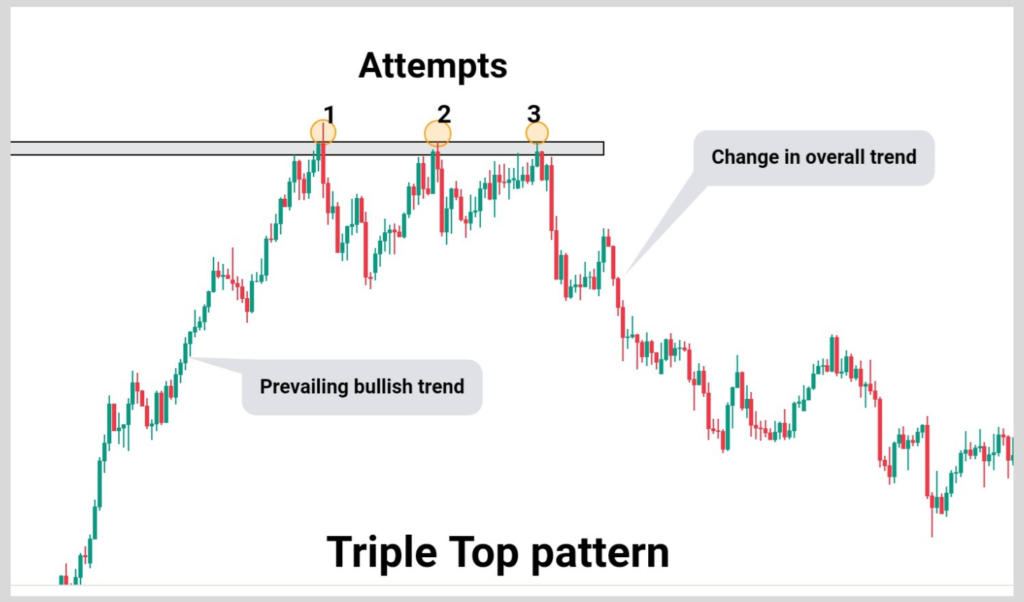
They aren’t as prevalent as the ones mentioned above, but they are also very strong trend reversal patterns.
They manifest in similar ways to the double tops and bottoms.
Triple tops and bottoms appear after three unsuccessful breaks of a resistance and support zone, respectively.
After your short break, the last and more advanced
types of price action patterns that will be discussed are the Breakouts.
Breakout patterns.
Briefly, a breakout pattern, as its name implies, is a price action pattern that seems to break resistance or support zones.
Right now, you would be learning 3 major breakout patterns.
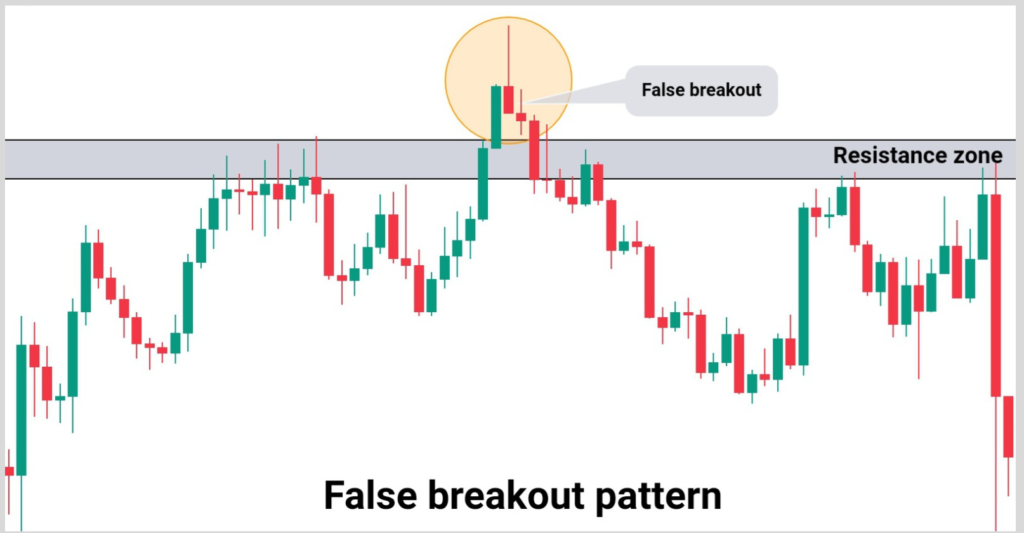
False breakout
A false breakout is a reversal price action, also known as “market manipulation“, in which the price breaks a zone and then quickly and impulsively reverses. It occurs in resistance and support zones.
Unfortunately, many amateur traders are the usual victims of this ‘bait’.
I can explain.
When the price breaks through a support or resistance zone, amateur traders think in their minds that it is a golden opportunity for them to place a trade…
Some may say,
“Oh, this bearish candle means a continuation.”
Others may say;
” Opportunities come but once; let me jump in.”
Only for them to place their stop loss and find themselves being taken out immediately.
Once these steps are triggered, you can agree that the price would most likely continue to reverse due to the fuel generated from their stops.
How to Trade False Breakout
- Identify strong bullish/bearish candles at resistance/support levels, taking out previous highs and lows
Wait for a strong full-body reversal
Then place your short or long entry at the opening of the next candle.
Another type of breakout pattern that you need to know is:
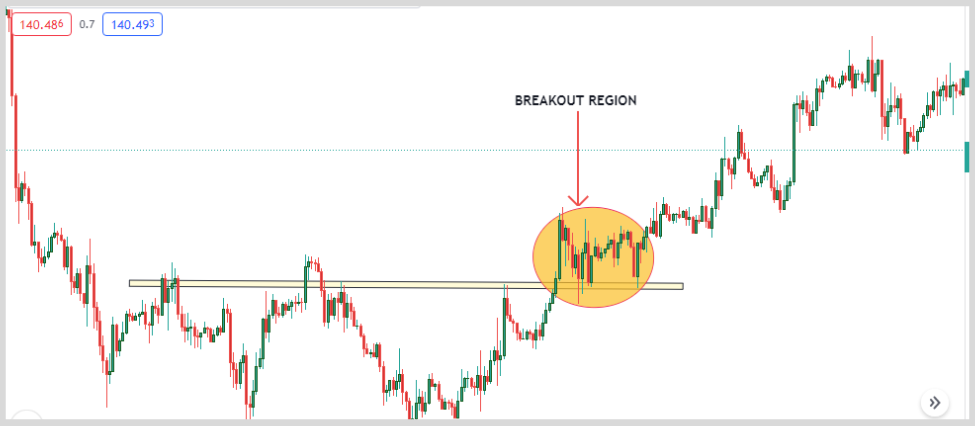
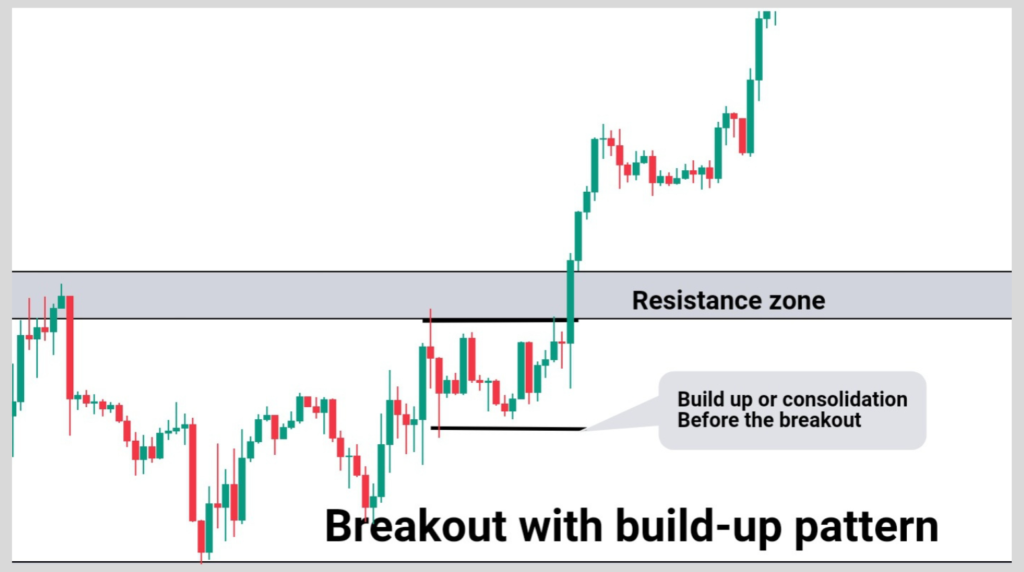
Breakout with build-up.
Breakout with a build-up price pattern is a trend continuation price pattern.
But first, to understand this concept, you need an idea of what build-up is.
What then is a build-up?
A build-up is simply a tight consolidation area, close to a resistance or support zone, with noticeably smaller candles.
For instance, when the price gets to a support zone and then starts to consolidate, it is imminent that buyers would hop into trades and expect for price to move against the prevailing trend.
Unfortunately, prices won’t do as they expect, as sellers would gather more fuel from their stops to push the market further downwards.
How To Trade Breakout Buildups
- Identify a previous downtrend, also
- Identify a consolidation area near a support zone,
- Then take your trade at the break of the support zone (and Vice versa for a long trade).
Breakout with re-test.
Breakout with re-test is another crucial breakout pattern that occurs frequently, and therefore,
You need to know it, and how to trade using it.
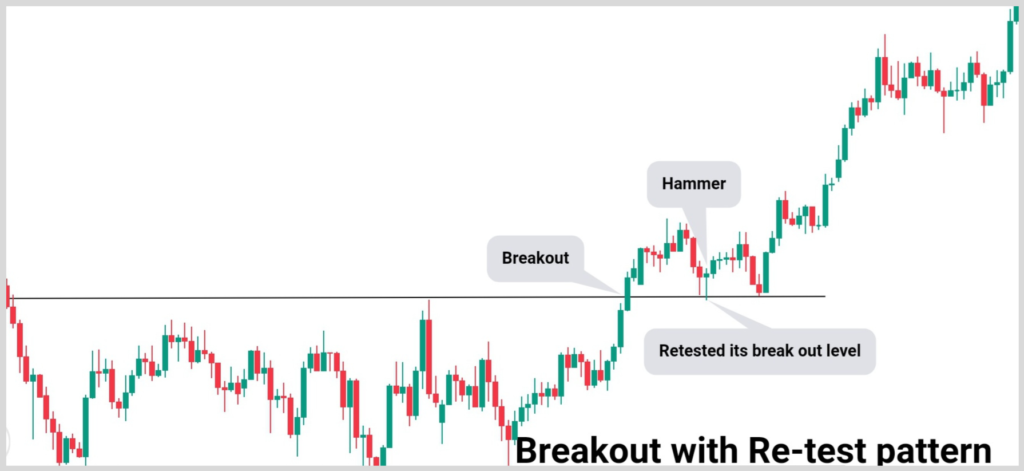
Let me define, Breakout with re-test is also a continuation price action pattern that allows us to hop in on the pre-existing trend.
A retest occurs when the price reverses its direction, after a break of structure or zone, to its breakout level.
How to trade Breakout & Retests
- Identify a break of structure or zone, and also a pullback to that zone.
- Be sure to see weakness in price action or reversal candles, such as a hammer, or engulfing candles, and
- You can take your trade at the opening of the next candle.
FAQ ( Frequently Asked Questions)
What Time Frame Do I Draw Support and Resistance from?
I strongly advise you to draw them from the higher timeframes, such as Monthly and Weekly.
Do I place my entries from the weekly timeframe?
Generally, the monthly and weekly timeframes are mainly for analysis, and by that I mean you should scale down to the lower time frames, like the 4-hour timeframe or 1-hour timeframe, to place your entries and stop losses, to increase your risk-to-reward.
Do support and resistance usually work?
If support and resistance are properly drawn, they usually hold and help you to identify key levels.
Conclusion.
In this ultimate guide, you have learned;
- Market Structure and its Types
- Support and Resistance and their types
- Swing highs and swing lows
- Price Action Patterns and their different types.
Just to mention a few of what you’ve learned.
I hope you’ve found this article has been able to broaden your knowledge about Market Structure and other aspects of it.
Let me know in the comment section below what price action patterns strategy you would implement in your trading system.