

In today’s tutorial, I will show you how to perform a top-down analysis in trading that delivers results effectively.
The strategies I’m about to share in this guide will lead you through the ins and outs of top-down analysis and explain how to achieve a 90% success rate.
I’m not one to brag, but this trading method is my personal favorite.
It has earned me more than $80,000 from a single trade and even helped me establish a hedge fund management company worth $150 million.
I’m not a fan of posting trading profits because I feel it’s very amateur.
However these are my AUDUSD entries on my smaller account.
Been holding across all my personal and investors account since the 3rd of march. pic.twitter.com/TnWCGy0hNS
— Dapo Willis (@IamDapo) April 26, 2023
So I decided to spend 1+ Hours Teaching my students this approach.
And the results were pretty much the same.

If you want to achieve similar results, keep reading.
The Concepts Of Top-Down Analysis for Trading
The concept of the Top-down approach is crystal clear…
It begins by viewing the price from the Bigger Picture (Higher Timeframe).
Why a Higher Timeframe? To have a comprehensive view of the markets.
When you spot a potential trend in lower time frames, checking a higher time frame helps to confirm the trend’s strength and direction.
Aligning multiple time frames in the same direction increases the probability of successful trades.
Let me explain:
In the early days of my unprofitable trading career, I struggled a lot with indicators because I thought they were the best tools for understanding price action.
But I was mistaken.
I had over 50+ trading indicator systems installed, but none of them worked because I was keyed to lower timeframes.
Every time these indicators suggested selling, I sold, and then the market moved in the opposite direction.
That’s because I was trading against the overall trend of the market.
How do you determine the overall trend of the market? The Higher timeframes.
The trends on higher timeframes are the ones that tend to last for a longer duration because of the time it takes to build up.
Key takeaway: The Longer it takes to form a pattern, the better
Here’s the thing:
If the higher timeframes indicate a bullish trend, but you’re trading with a bearish perspective on lower timeframes, you are in a Deep Sh**t!!.
While you might make some profits temporarily, statistically speaking, the market is likely to move against you according to the trend shown by the higher timeframes.
This is because higher timeframes provide a broader view of the market’s movement.
Keep in mind: When using the top-down analysis approach, you don’t necessarily execute trades on the higher timeframes.
Instead, you use them to anticipate the market direction on LF.
Thanks to a Hedge fund trader who helped simplify things for me by introducing the concepts of the top-down approach to trading, I found my breakthrough.
During our beginner’s tutorial, the first thing he advised was to “zoom out.”
What does “zooming out” mean?
It’s about looking at the market from a wider perspective, which is where the idea of top-down analysis comes into play.
What Is Top-Down Analysis In Trading?
As a technical analyst, Top-Down analysis is the scaling down from the “highest” possible timeframe to the “lowest” possible timeframe to make a trading or investment decision.
It can also be described as the usage of Multiple time frames during analysis for a potential entry or entries, usually from the highest possible timeframe to the lowest possible timeframe.
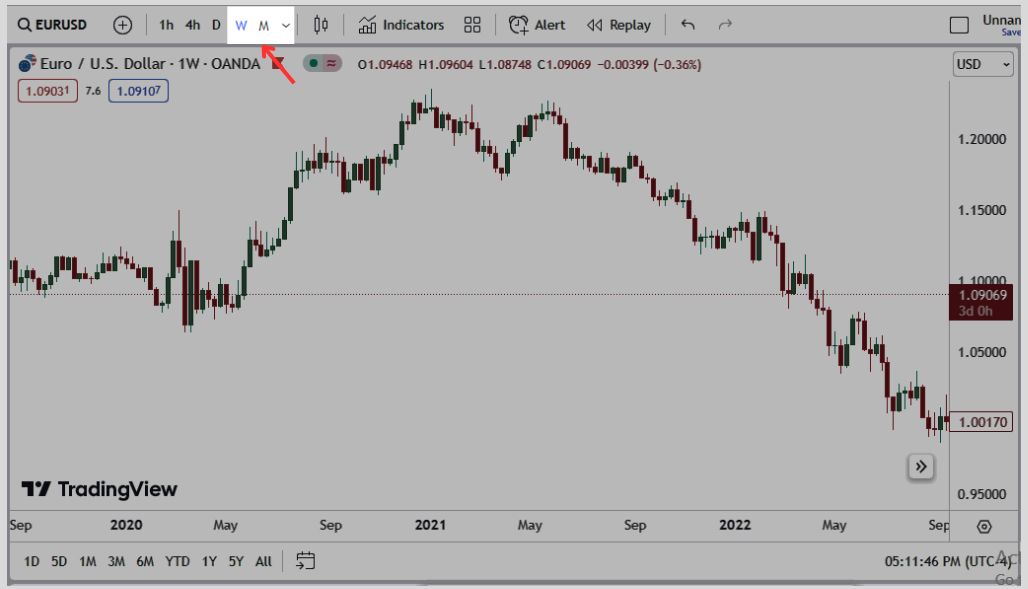
Top = Monthly and weekly time frame
Down = Daily and 4hr time frame
With that, we are only looking for potential selling opportunities.
How To Do Top-Down Analysis (Case Study)
Just as you might have been able to deduce from what we have discussed earlier, the manner of approach using this method is going from the highest timeframe to the lowest possible timeframe to make analysis and entry, respectively.
So, how exactly can you trade using the Top-Down analysis?
There are 4 main steps that you need to take when making the technical analysis using this method.
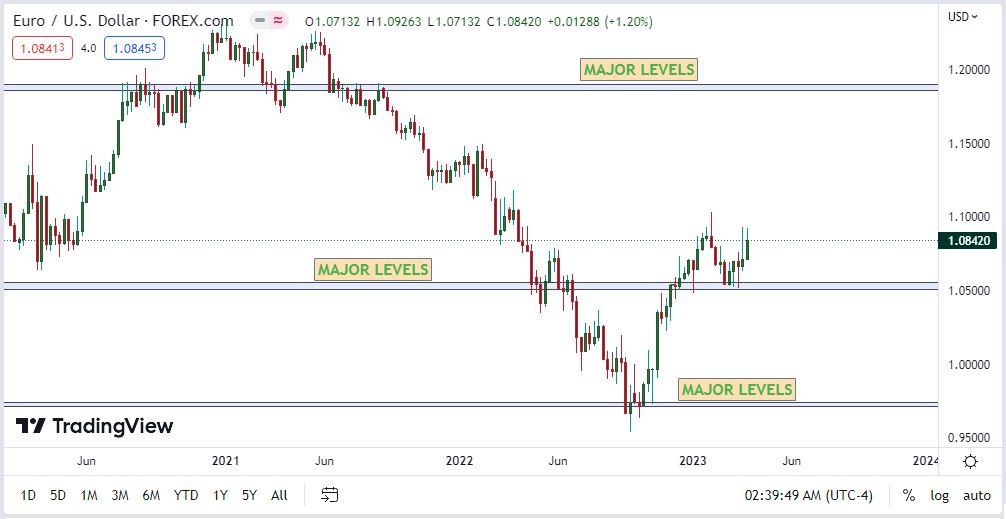
Top-down Approach #1: Plot Key Levels (The Major)
Key Levels are basically important areas known as support and demand zones.
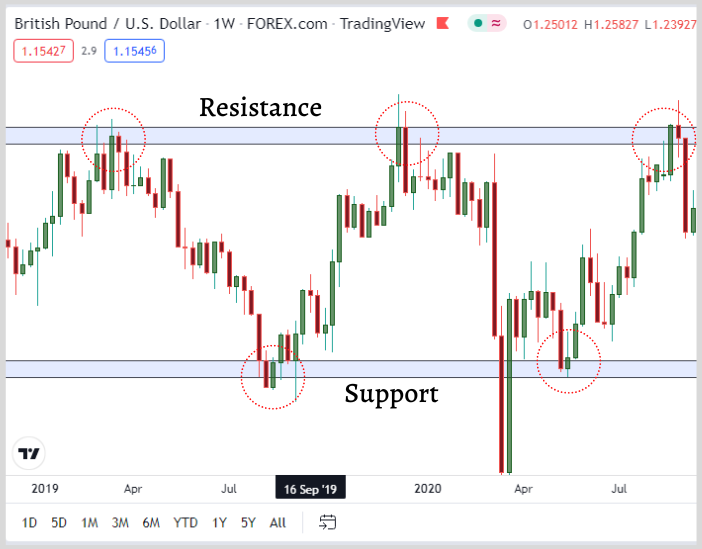
However, in this case, they are plotted on Monthly or weekly timeframes, which makes them significant and hence called Major Levels.
Why? Because these levels tend to be more significant than levels on lower timeframes, especially in top-down analysis.
It takes a considerable amount of time to show respect for these levels, and once it does, best believe the price tends to react.
If it takes 50 candles to form a head and shoulder pattern on a 4-hour candle, it is highly significant, as it took the market approximately 8 days to form that pattern.
The rule is that the longer it takes to form a trend, chart patterns, and trade setups, the more significant it will likely play out.
The same rules applied for plotting key levels.
While chart formations on lower time frames also play out most of the time, when they form on a higher timeframe, it should be taken seriously because, as you drill down in time frames, the charts become more polluted with false moves and noise.
Note: I use the rectangular block as support and resistance on Tradingview.
Top-down Approach #2: Identify Patterns
Plotting your key levels helps you identify key areas or zones on your charts, but patterns let you anticipate the price’s next move.
Patterns in Trading can be any price formations that tend to be recognizable and have a higher probability of playing out based on past historical data.
This works pretty well in real-time markets because history will always repeat itself in Price action…
Whenever you see any pattern formation on the charts, check the history; it has happened before.
And there are 20+ Trading patterns.
And trust me, you don’t need to study all the forex patterns to become profitable; it doesn’t matter because less is more.
Focusing on a few high-probability forex patterns is more effective for profitability than trying to study and master all possible patterns.
Chart patterns are one of the most commonly used forex patterns and need a little bit of pattern recognition.
These patterns can be used to;
- Identify trends
- support and resistance levels
- potential entry and exit points for trades
- Continuation and Reversals
Candlestick Patterns: such as Bullish engulfing, shooting star, etc.
Top-down Approach #3: Flow Of The Markets (Trend)
The primary purpose of employing Top-down analysis involves analyzing the charts on Higher timeframes to anticipate potential market trends.
Traders then utilize these trends on lower timeframes to capitalize on substantial price movements.
This strategy is commonly associated with swing trading.
However, it’s important to note that this approach isn’t confined solely to swing traders.
It proves effective for scalping and day trading strategies as well.
The concept is to know where the direction of the market is on higher timeframes and trade based on those movements on lower timeframes.
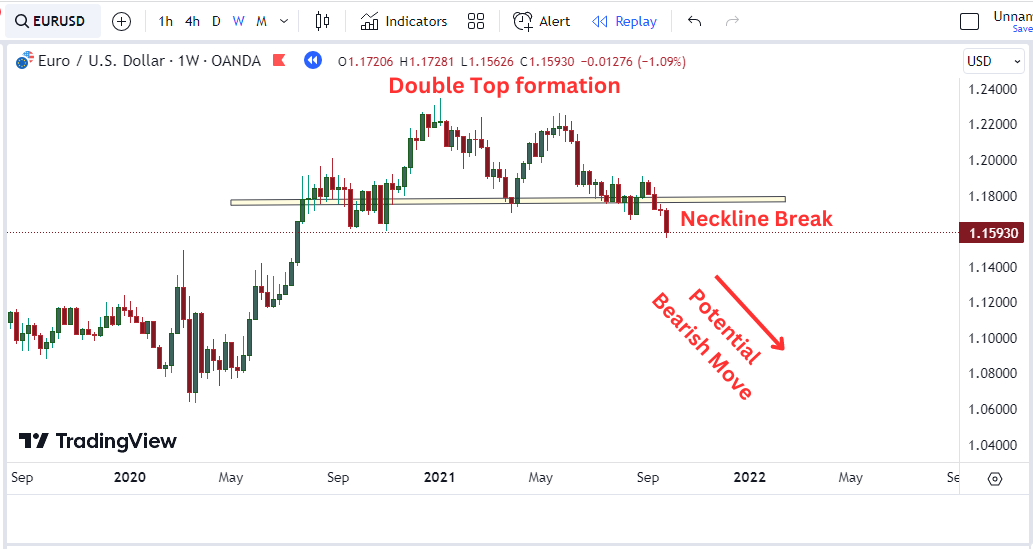
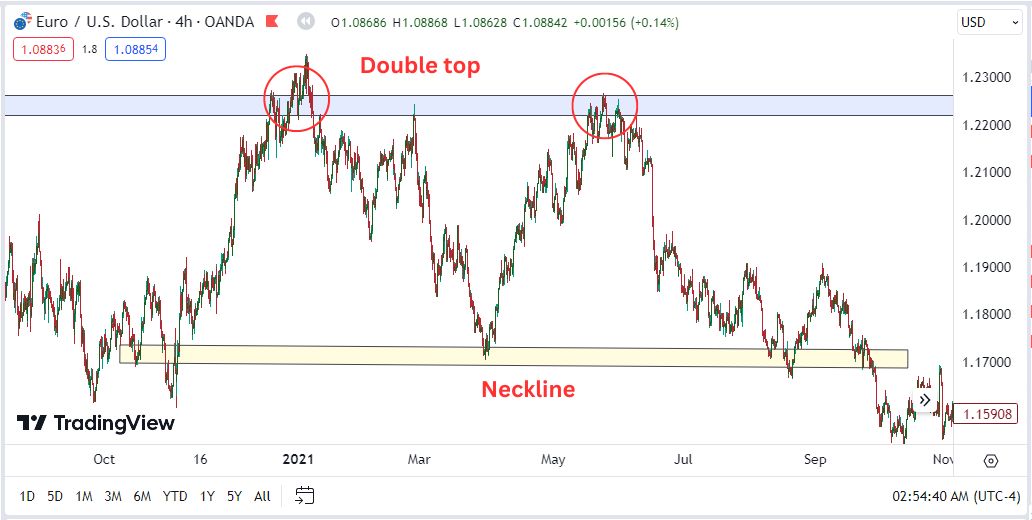
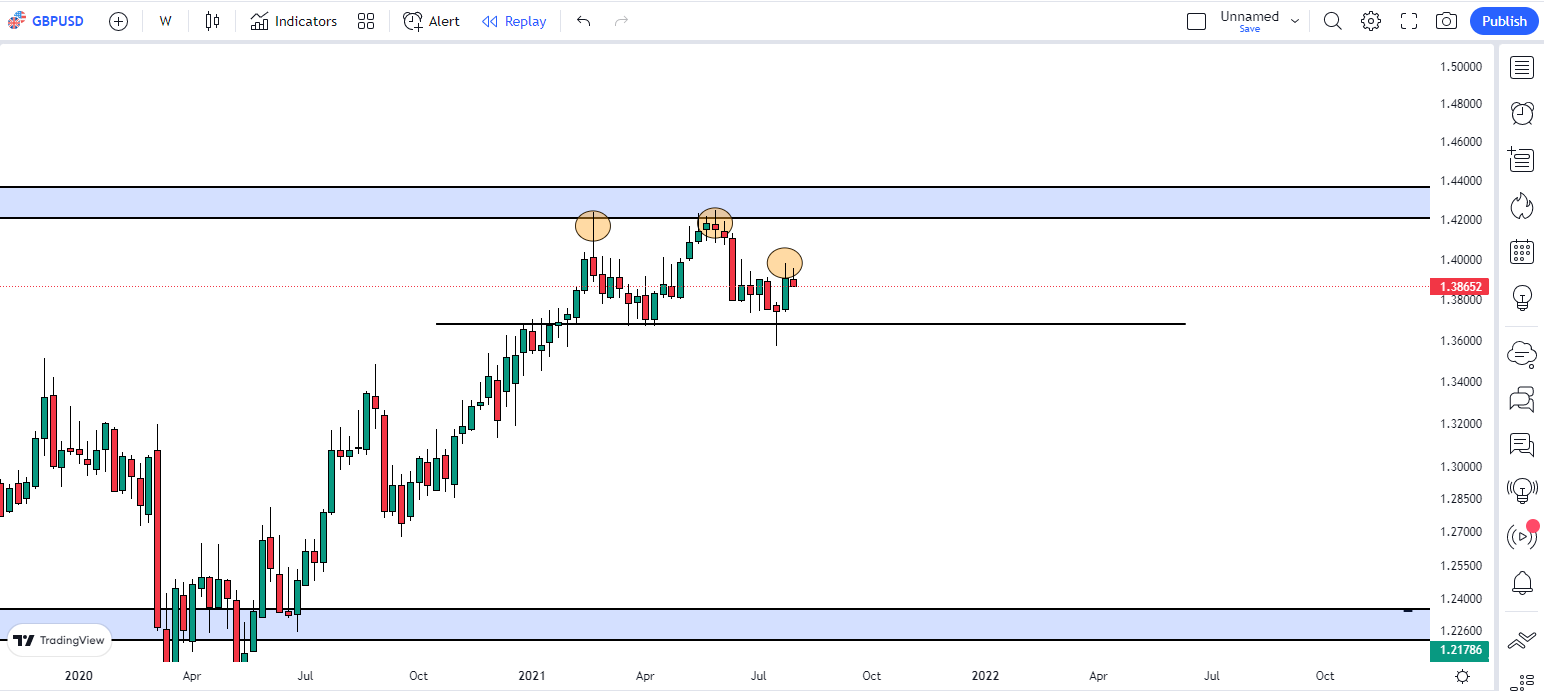
Earlier on, price formed a double top formation on the weekly timeframes, as shown below.
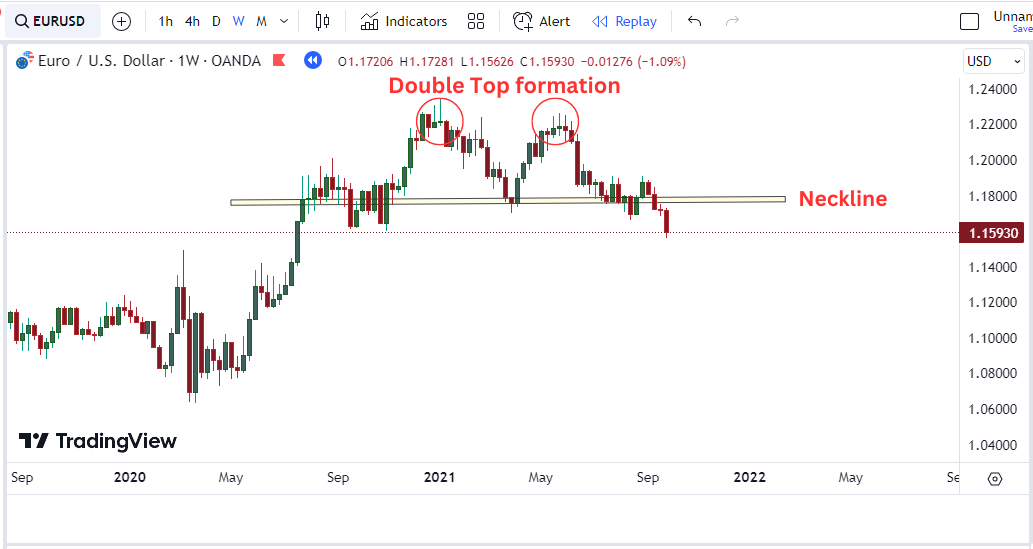
Price action 101: Whenever the price breaks below the neckline of a chart pattern, there is a high tendency price will fall for a longer period.
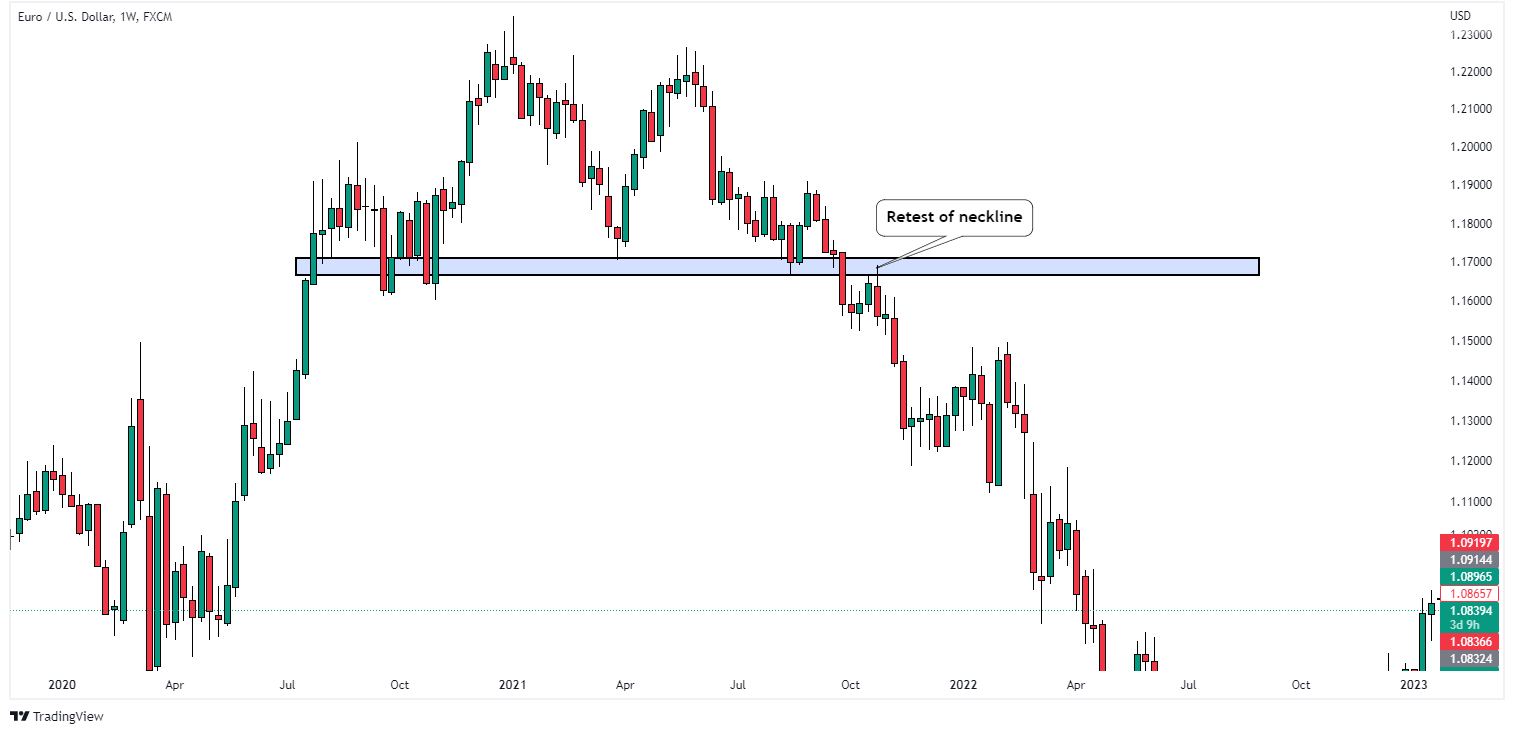
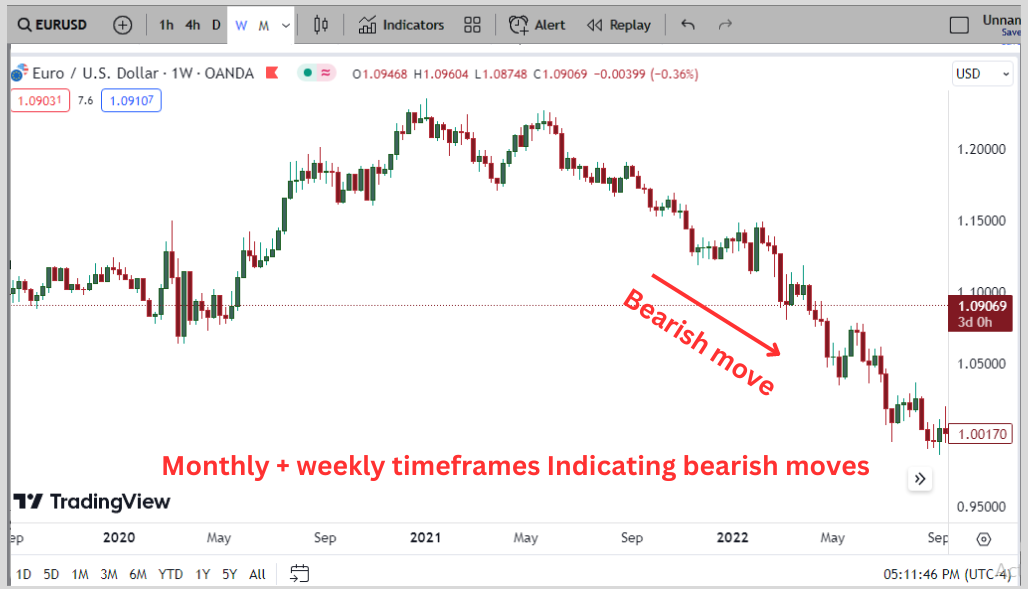
With that, we could anticipate the price’s next move based on our analysis of the Higher timeframe as shown.
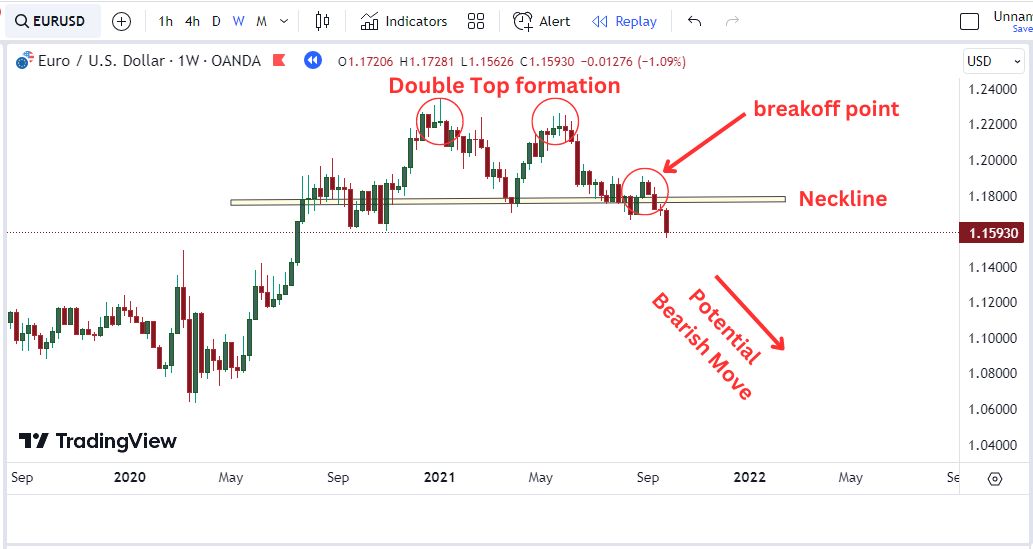
In conclusion, the higher time frame indicates a potential bearish move.
So you need to scale down on a lower timeframe for selling opportunities, and that leads us to the next section.
Top-down Approach #4: Plot Key Levels (The Minor)
At this point, things start to get complicated because I mentioned plotting key levels earlier on.
The previous step involved major levels that were marked on higher timeframes, while now we are depicting these levels on lower timeframes.
Don’t get me wrong, the major key levels tend to be more significant because of the time it takes to form, but the minor key levels are important in spotting out entries and existing points of the markets.
As you plot Major levels and narrow down to lower timeframes, Price movements are magnified on shorter timeframes, allowing traders to capture swing or trading opportunities.
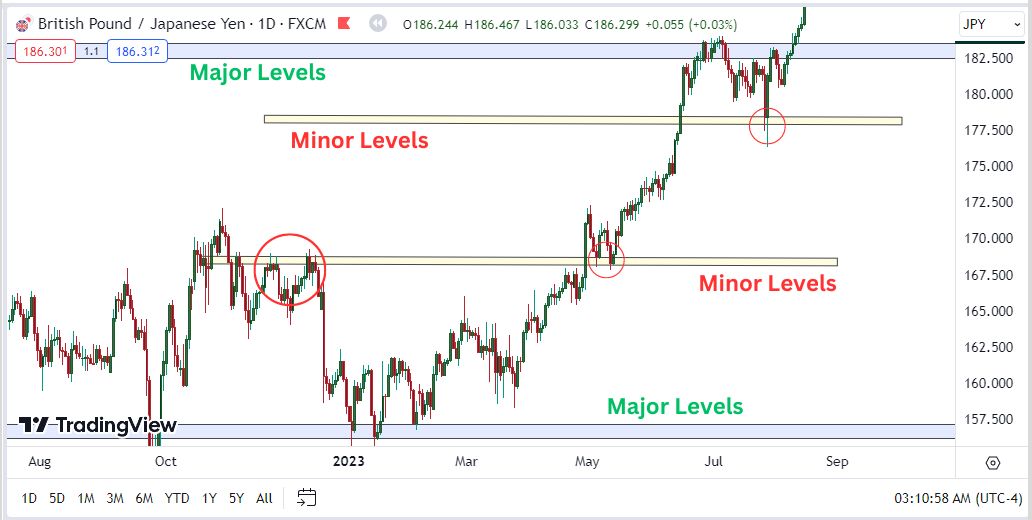
The Minor levels help you identify turning points that cannot be seen on higher timeframes as you zoom in on price.
They are drawn on lower timeframes, which are Daily or the 4hrs.
This is why I indicate my Major levels with sky blue color
And Minor Levels with Light Yellow on my charts.
Both play out nicely.
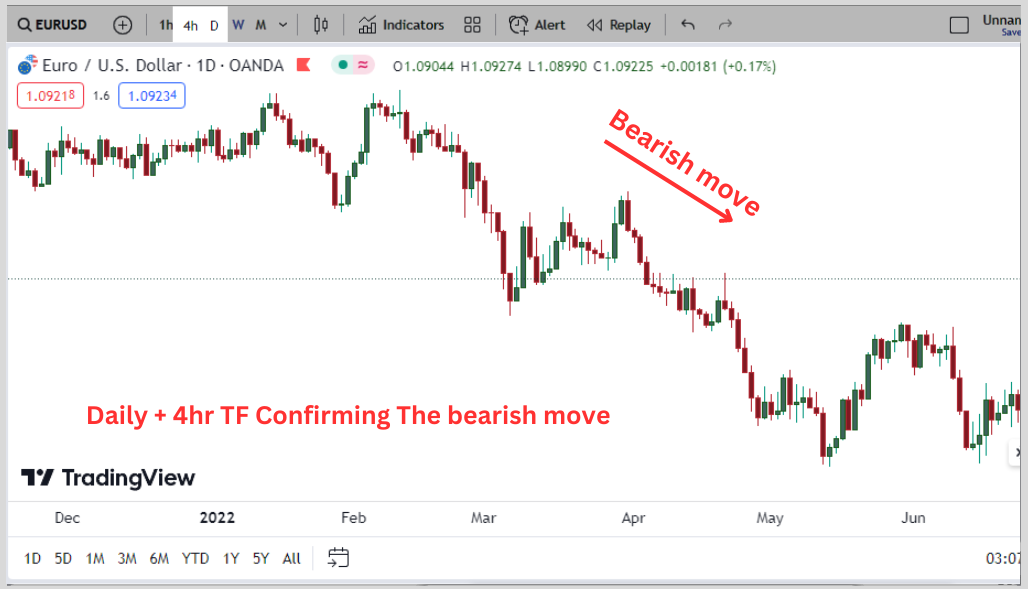
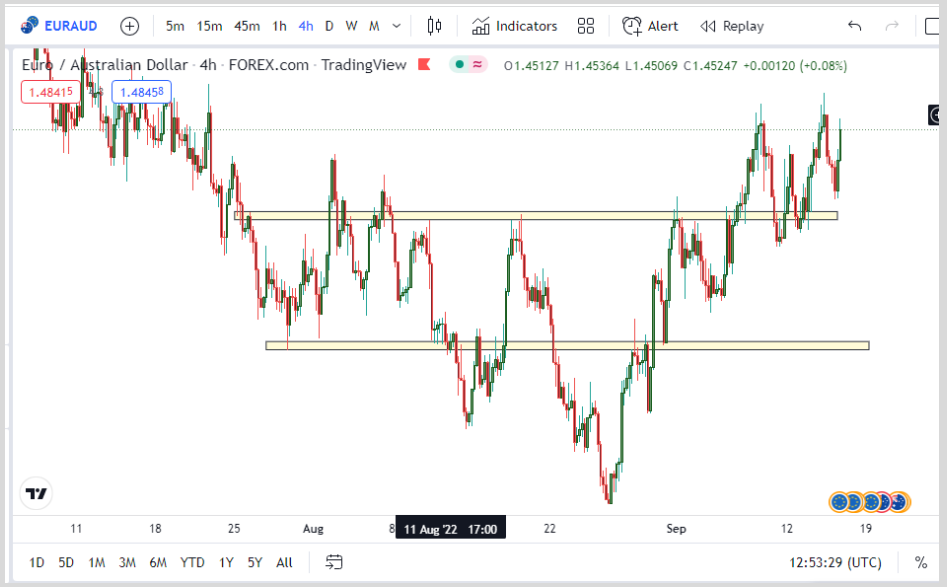
Recall from our previous analysis on the higher timeframe.
This is how the same charts look on Lower timeframes (4hr)
Top-down Approach #5: Entries & Exists Region
We did the analysis, and the Higher timeframe says sell.
So we scaled down to 4hr or 1 hour for selling opportunities.
But we just can’t start selling right away; we need to find a suitable entry point or pullbacks to ride along the trend.
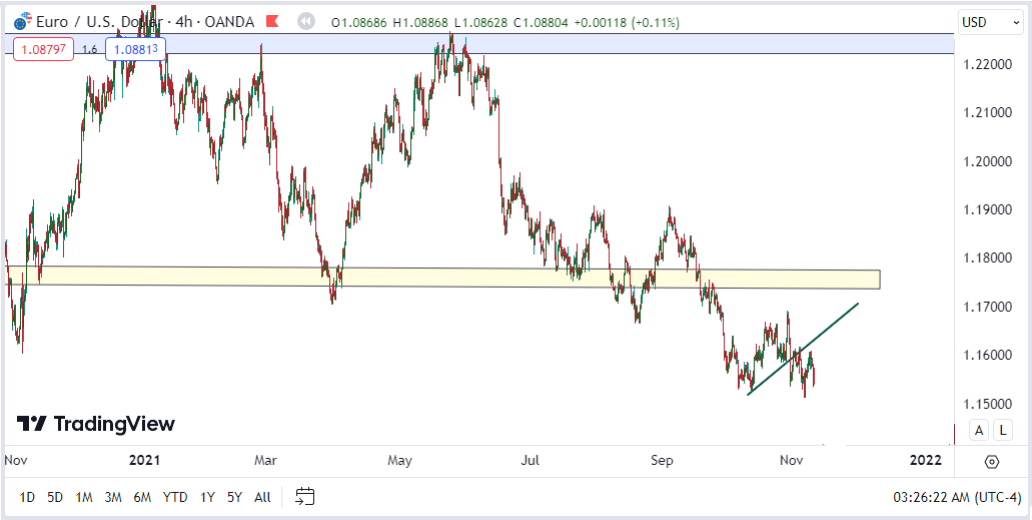
You can do that by drawing your counter-trend line or plotting your Fibonacci in conjunction with any strategy of your choice.
The 4-hour timeframe or the 1-hour timeframe is where you would be looking for entry opportunities.
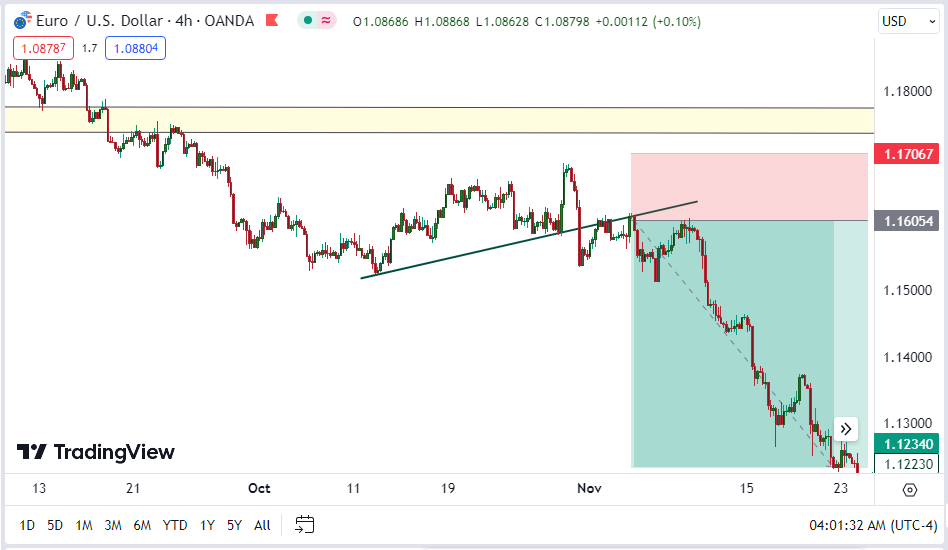
That is how you go about using 50pips to capture over 500+ pips on a single trade.
The top-down analysis helps you achieve that. Let’s explore some of its benefits.
Benefits Of The Top-Down Analysis
Amongst the several benefits of using the top-down analysis, below are some of its crucial benefits as they relate to trading and investment.
One of its most crucial benefits is its technical research procedure, used by investors to analyze and develop an investment strategy.
Its methodology involves breaking down the ‘big picture’ into smaller components to understand the underlying trends in the market.
The Top-Down analysis helps investors to understand the overall ‘flow of the river’ so as to enable them to invest or trade in that direction.
For knowledge, in the fundamental world, where economic factors are what help an investor to make investment or trading decisions, the steps of the Top-Down analysis involve researching macroeconomic indicators such as inflation, unemployment rate, and interest rates to identify potential investment opportunities and risk in the market.
So, on a more general note, both in the technical and fundamental worlds, Top-Down analysis helps investors and traders to assess how their investments will be affected by changes in the markets and macroeconomic factors.
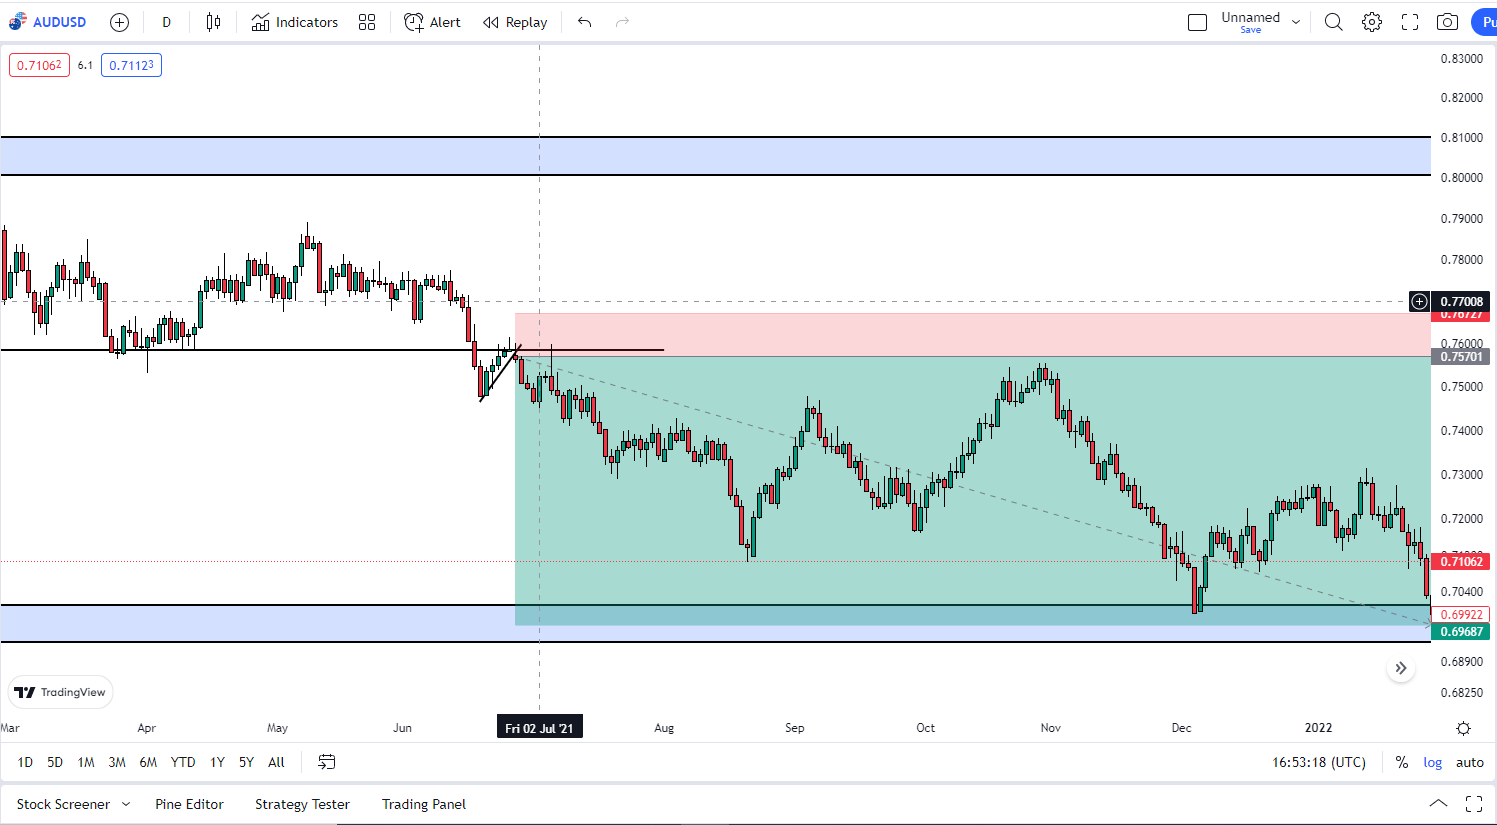
Top-Down Analysis: (AUDUSD Case Study)
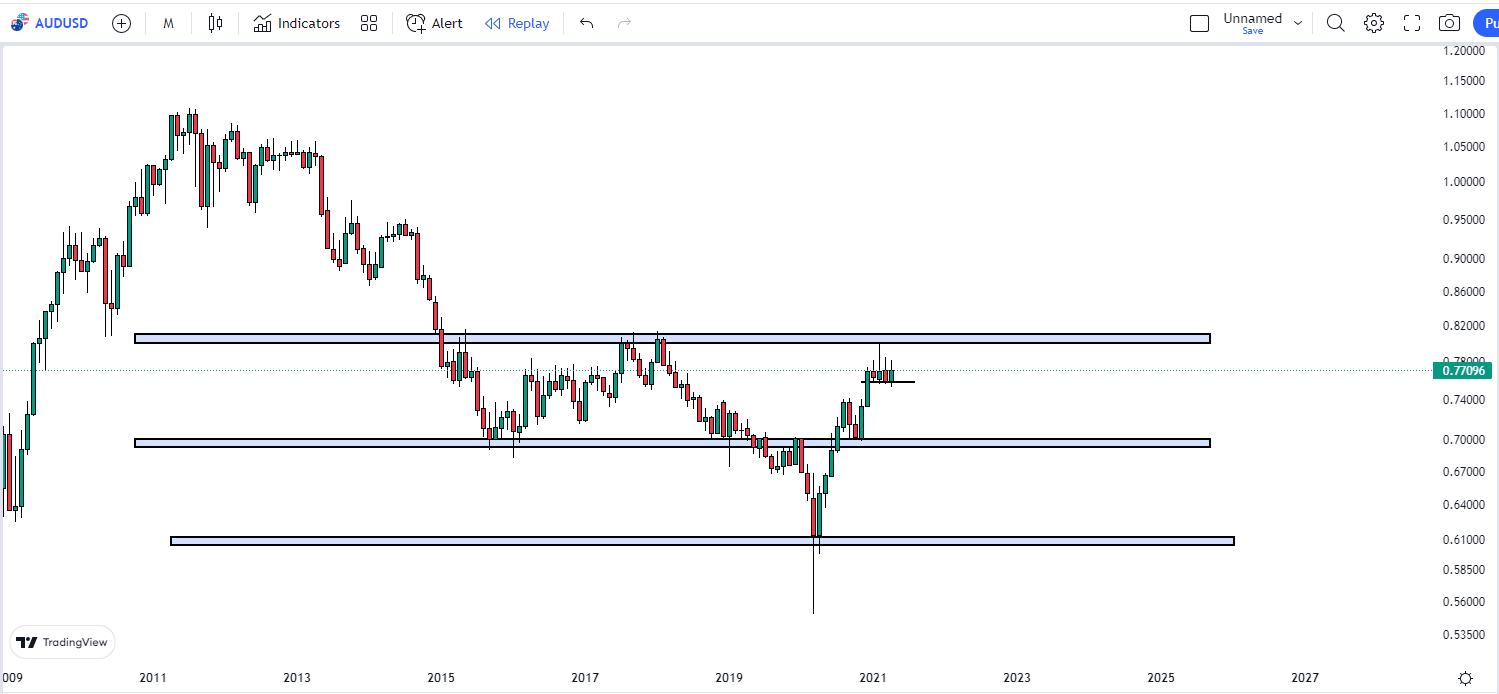
Following the step-by-step approach of the top-down analysis, I went to the monthly report to draw my key levels.
After that, I moved to the weekly chart to identify the chart pattern that had formed, which was the Head and Shoulders pattern, as you can see below.
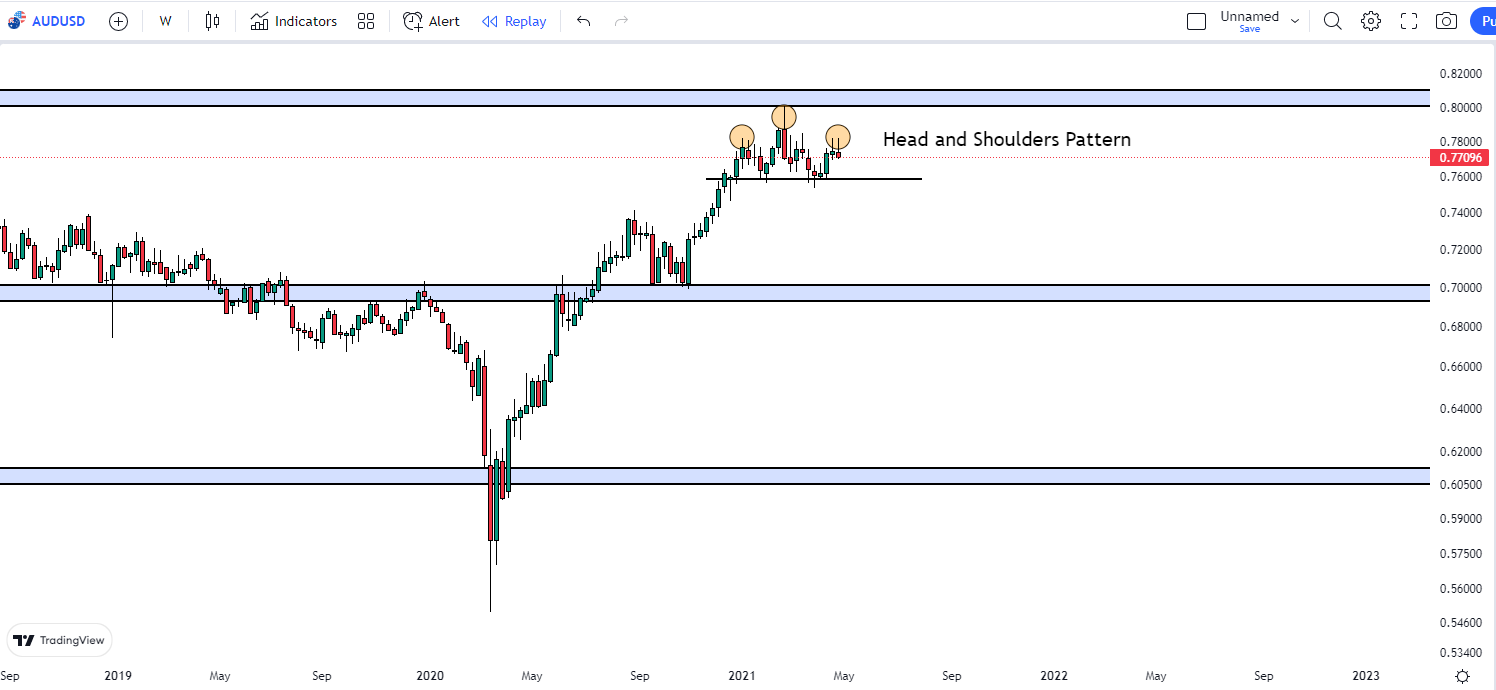
So I waited for the break of the neckline of this Head and shoulder confirmation.
I then scaled down to the Daily timeframe to place my entry at the break of the Daily counter-trendline, as you can see below.
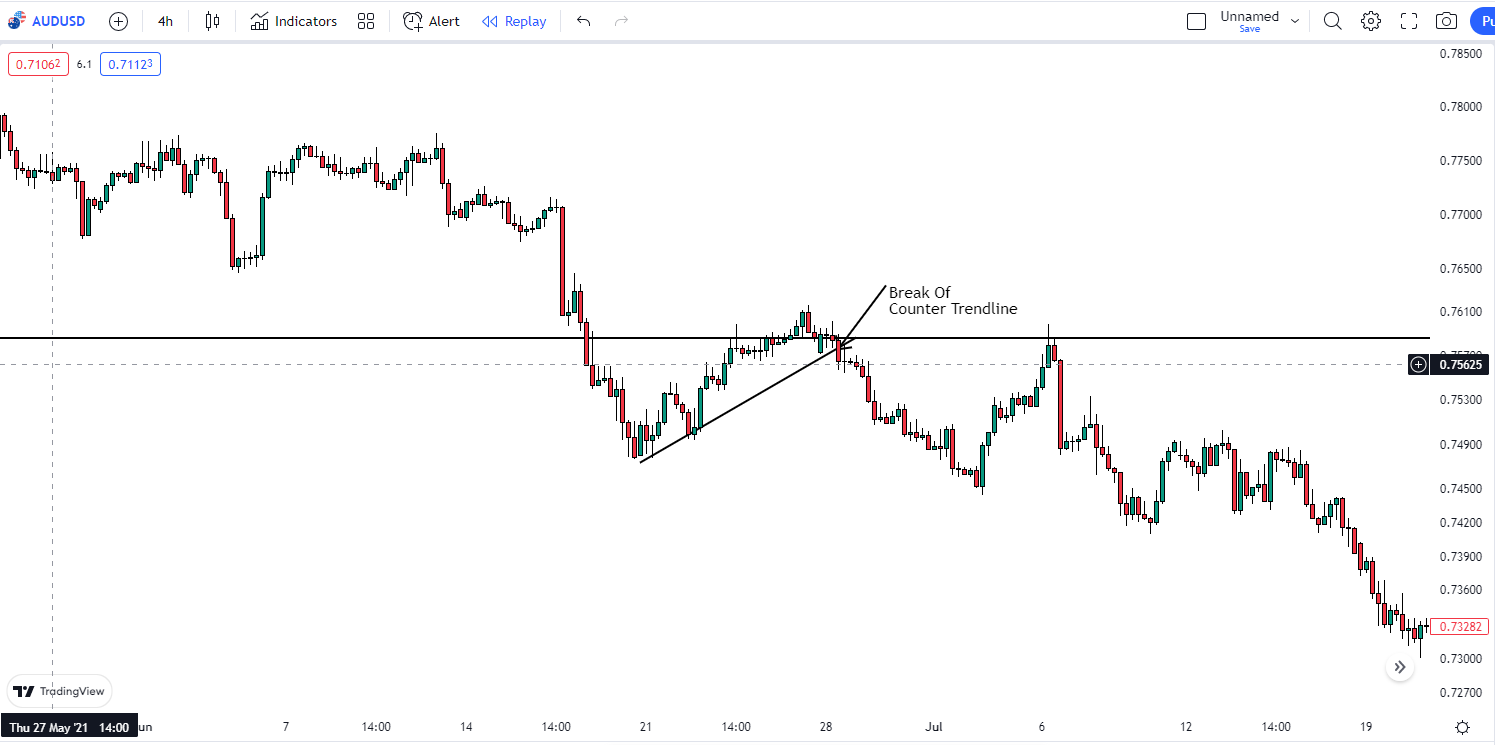
On this trade alone, I was able to make about 600 pips!!!
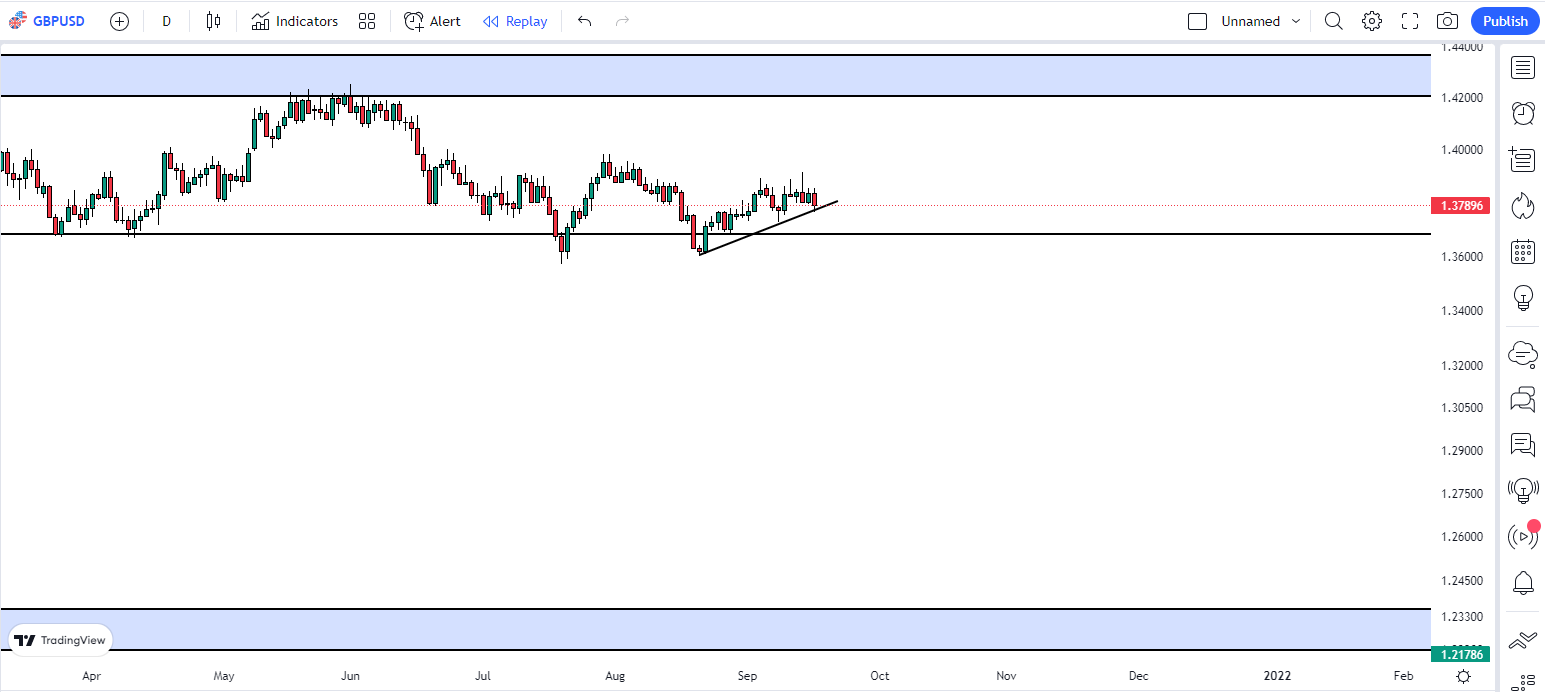
Top-Down Analysis: (GBPUSD Case Study)
Let’s take a look at this GBPUSD
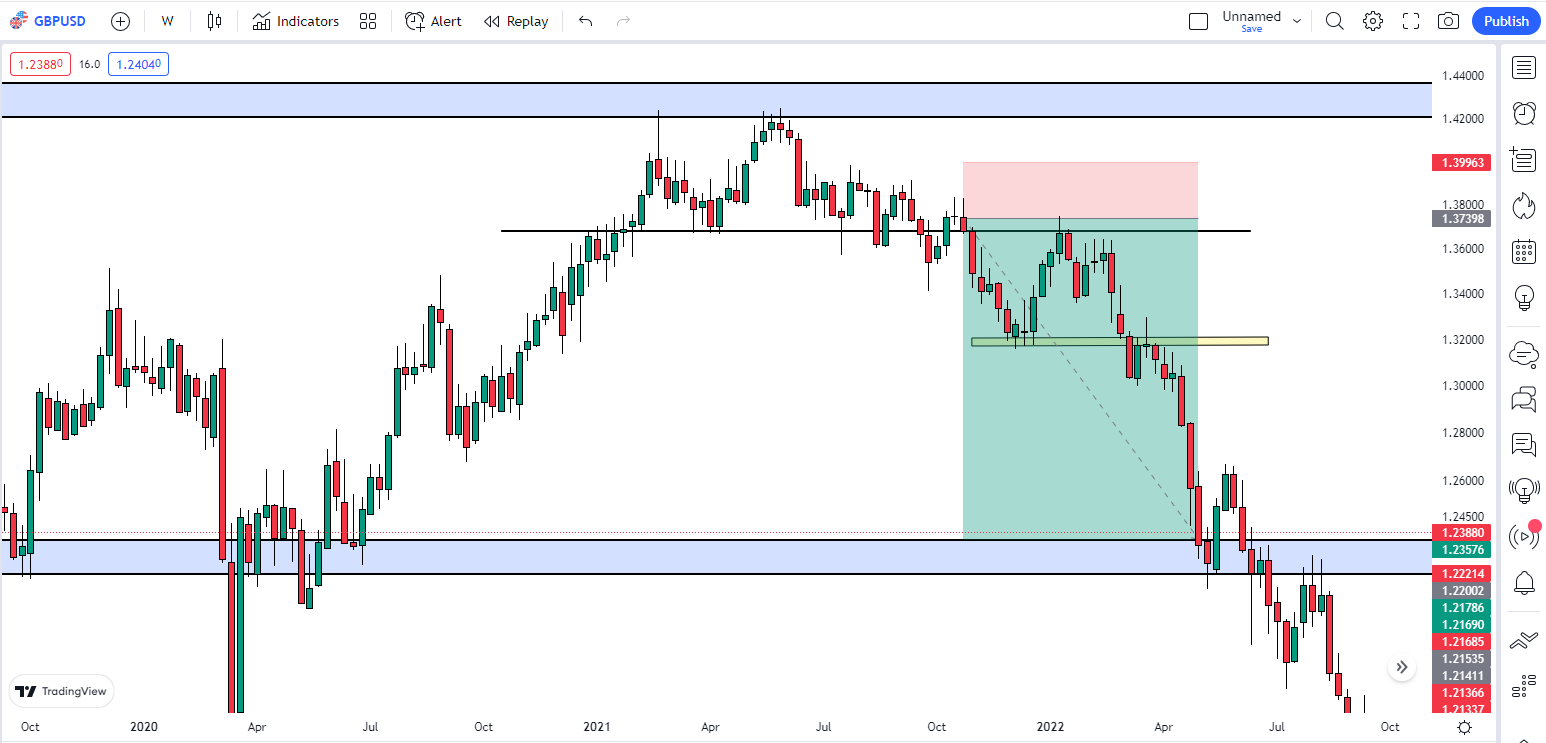
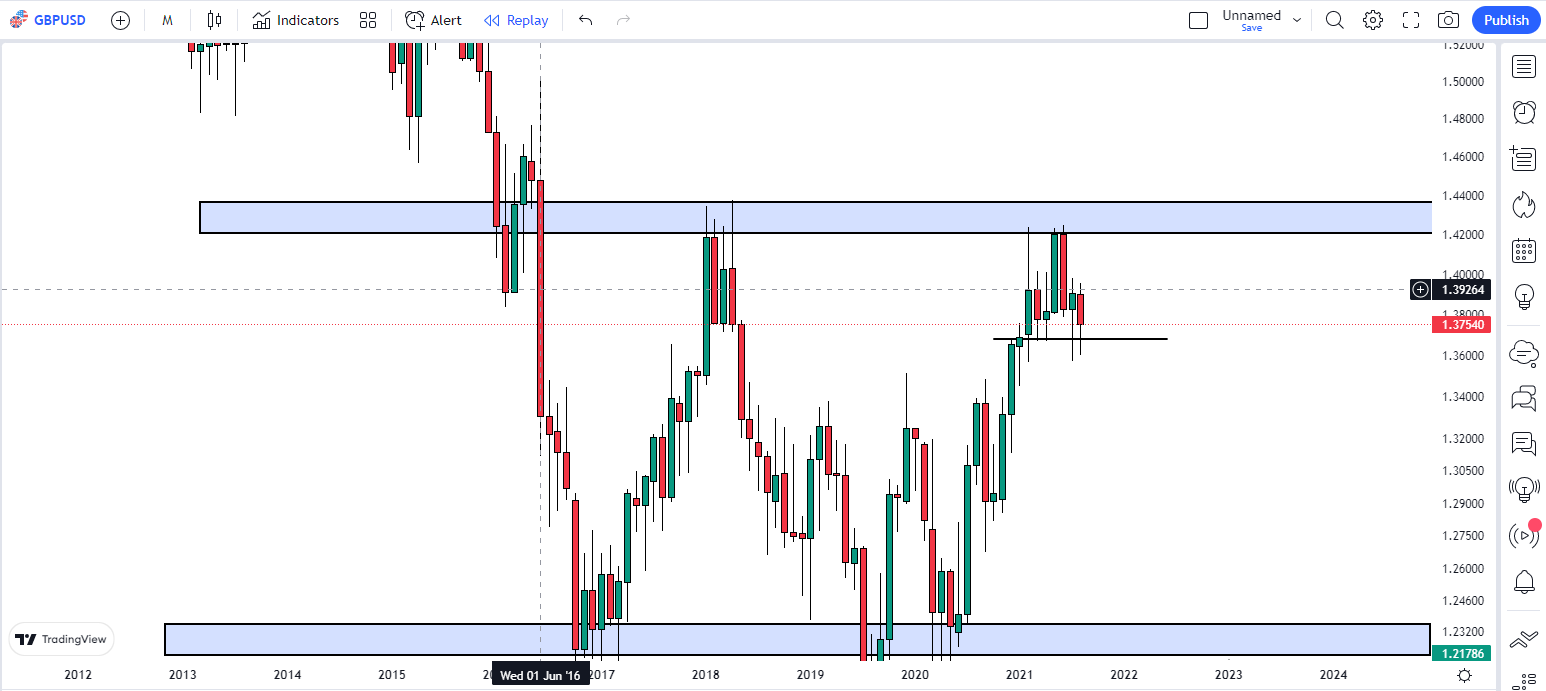
Using the same step-by-step approach I used in the trade above, firstly, I went to the monthly timeframe to plot my key levels as shown below.
Secondly, I scaled down to the weekly timeframe to identify chart patterns and possibly adjust my key levels a bit.
Guess what? It was the same Head and Shoulders pattern that was on the weekly timeframe.
You know what it means when we see a Head and Shoulders pattern.
Following the same step, I went to the daily timeframe to draw my counter-trendline, which you can see below.
I had my entry on the 4-hour timeframe after the candlestick break on the same timeframe.
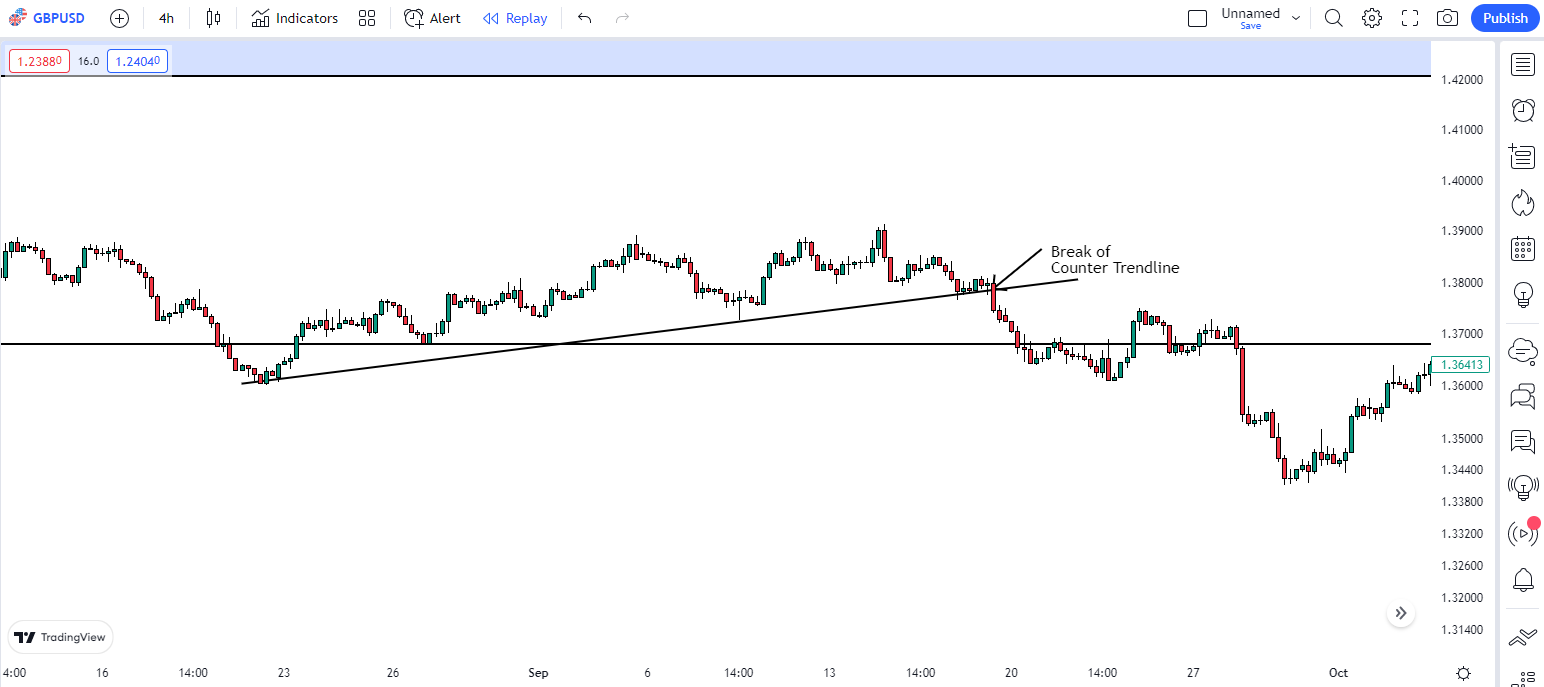
And the results? +1000 pips in profits
There you go again, another very obvious practical example of how powerful the Top-Down Analysis is whenever you want to make a trading decision.
Conclusion
The top-down analysis is a very powerful approach to the financial market that, if properly used, could make you a lot of money.
Investment banks, Private Investors, and big traders all have other sophisticated trading systems that help them make trading decisions.
They also deploy the use of the Top-Down analysis as taught in the Forex Mastery course when taking investment-based decisions.
Now over to you, how have you been using the trading, or possibly using the Top-Down analysis in your trading?
Share your thoughts with me in the comment section.


9 thoughts on “Top-Down Analysis In Trading: Made $80,000 + Case Study (Complete Guide)”
Best platform to learn Forex
Have been using the top down analysis just as you thought us in the course and it has been working for me .
Thank you for this great Wisdom
Please Sir, can we please get the PDF copy of this Top Down Analysis Teaching
Dappo, he is the Goat. The man be changing lives out here. Thanks Mentor.
Actually I was using it unknowingly, but I developed my entries with break of counter trendline from your teaching. Thank you for that knowledge, I lacked that before.
Am waiting for Wallis capital prop, for us swing traders
Best website to learn Forex Trading
Great man indeed!
THANKS A MILLION!
Thanks much for the guidance
But please how do we meet in person cause I will like to learn dis more in person
Thanks for the update